Which corresponds to the break-even level. Determining the break-even point. Break-even point: what to consider
- the sales volume at which the company covers all its expenses without making a profit.
Its value plays an important role in the sustainability and solvency of the company. The degree to which sales volumes exceed the break-even point determines the (stability margin) of the enterprise. In turn, how profit grows with changes in revenue.
Formula for calculating break-even point
To calculate the break-even point, you need to divide the costs into two components:
- - increase in proportion to the increase in production (volume of sales of goods).
- - do not depend on the number of products produced (goods sold) and on whether the volume of transactions grows or falls.
Let us introduce the following notation:
| IN | — | sales revenue. |
| Rn | — | sales volume in physical terms. |
| Zper | — | variable costs. |
| Zpost | — | fixed costs. |
| C | — | price per piece |
| ZSper | — | average variable costs (per unit of production). |
| Tbd | — | break-even point in monetary terms. |
| Tbn | — | break-even point in physical terms. |
Formula for calculating the break-even point in monetary terms:
(in rubles, dollars, etc.)
Tbd = V*Zpost/(V - Zper)
Formula for calculating the break-even point in physical terms:
(in pieces, kilograms, meters, etc.)
Tbn = Zpost / (C - ZSper)
Example of calculating the break-even point
The same data on the graph. Break-even point Tbn = 20 pieces
At the break-even point, the income line crosses and goes above the total cost line, the profit line crosses 0 - it moves from the loss zone to the profit zone.
How fixed costs, variable costs and price affect the break-even point, see.
At first glance, the formula for calculating the break-even point is quite simple, and there should not be any difficulties in calculating it. But in reality, everything is not so simple.
Four important assumptions when calculating the break-even point
- We are talking about revenue (sales volume), so we believe that all for sale produced or purchased products. Warehouse stocks are not taken into account.
- Variable costs are directly proportional depend on sales volume. This doesn't always happen. For example, the case where in order to increase production volume it was necessary to build a new workshop will have to be calculated in a more complex way.
- Fixed costs do not depend from sales volume. This doesn't always happen either. If, in order to increase the volume of production, it was necessary to build a new workshop, hire more management personnel, increase payment for utilities - this case also does not fit the general formula.
- Break-even point is calculated for the enterprise as a whole or for some average product.
When calculating the break-even point, probably the most important limitation is assumption 4. To make the calculation for each product separately, you need to know what share of fixed costs falls on each product. If there are many products, calculating break-even points separately for each product becomes a complex task that requires a large amount of calculations.
Hello! Today we’ll talk about the break-even point and how to calculate it.
Any person who decides first of all thinks about making a profit. When running a business, there are production costs - these are all the costs of manufacturing and marketing products. They are subtracted from the total sales revenue in monetary terms, obtaining a positive (profit) or negative (loss) result. For the successful functioning of an enterprise, it is necessary to know the boundary of the transition of revenue into profit. This is the break-even point.
What is the break-even point
The volume of production at which all income received can only cover total costs - this is the break-even point(from English break-even point - point of critical volume).
That is, this is the minimum amount of revenue in monetary terms or the produced and sold volume of products in quantitative terms, which only compensates for all production costs.
Reaching this point means that the company is not operating at a loss, but is not yet making a profit. The result of the activity is zero. With each subsequent unit of goods sold, the company makes a profit. Other names for this term: profitability threshold, critical production volume.
Why do you need to know the break-even point?
The value of this indicator is important for assessing the current financial condition of the enterprise, as well as for economic planning for the future. The break-even point allows you to:
- Determine the feasibility of expanding production, dealer network, mastering new technologies and types of products;
- Assess solvency and financial stability, which is important for company owners, investors and creditors;
- Monitor changes in indicators over time and identify bottlenecks in the production process;
- Calculate and plan a sales plan;
- Determine the acceptable amount of revenue reduction or the number of units sold so as not to go to a loss;
- Calculate the impact of changes in price, production costs and sales volume on the financial result.
What data is needed to calculate the break-even point
![]()
To correctly calculate the indicator, you need to understand the difference between fixed and variable costs.
And also know the following information:
- Price of 1 unit of products or services (P);
- The volume of products produced and sold (in the classical calculation model) in physical terms (Q);
- Revenue from products sold (B). To calculate the threshold in physical terms, this indicator is not necessary;
- Fixed costs (Fc.) are production costs that do not depend on the volume of production. They do not change for a long time.
These include:
- Salaries and insurance premiums of engineering and technical workers and management personnel;
- Rent for buildings, structures;
- Tax deductions;
- Depreciation deductions;
- Payments on loans, leases and other obligations.
5. Variable costs(Zper) are production costs that increase or decrease depending on the increase or decrease in the production of goods or the volume of services provided. The value of the indicator can vary widely, instantly responding to any changes in the company’s activities.
These costs include:
- Cost of raw materials, components, spare parts, semi-finished products;
- Salaries and insurance contributions of key production workers and personnel working on piecework;
- Electricity, fuels and lubricants (fuels and lubricants), fuel;
- Fare.
The division of all costs into fixed and variable is conditional and is used in the classical model for calculating the break-even point. The specifics of a number of economic entities imply a more precise allocation of costs into separate types according to economic meaning.
In particular, production costs may additionally be:
- Conditionally permanent. For example, warehouse rent is a fixed component, while the costs of storing and moving inventory are a variable component;
- Conditional variables. For example, the payment for depreciation (wear and tear) of capital equipment is a constant value, and the cost of planned and routine repairs is a variable value.
Cost accounting systems at different enterprises differ (for example, standard costing, direct costing, variable costing, etc.). There is a division of variable costs into individual ones for each product, a division of fixed costs into fixed and individual ones for each product, etc.
This article will examine in detail the classic model for calculating the break-even point for one product, and also provide an example of calculation with several types of goods.
Formula for calculating the indicator

Using the mathematical method, the break-even point (abbr. BEP) is calculated both in monetary and in kind terms. It all depends on the characteristics of a particular enterprise. When calculating according to the classical model involving one product (or several - then average data are taken), assumptions are taken into account for a number of factors:
- Fixed costs within a given production volume remain unchanged (this level is called relevant). This also applies to variable costs and prices;
- Product output and the cost of finished products increase or decrease linearly (directly proportional);
- Production capacity is constant over a given calculation interval;
- The product range does not change;
- The effect of inventory size is insignificant. That is, the amount of work in progress has minor fluctuations and all produced products are released to the buyer.
This economic indicator should not be confused with the payback period of the project. It shows the time (months, years) after which the company will begin to receive profit from its investments.
Break-even point in monetary terms
The calculation formula will show the minimum amount of revenue that will cover all costs. The profit will be zero.
Calculated as follows:
![]()
In the denominator, the difference between revenue and variable costs is the contribution margin (MR). It can also be calculated for 1 unit of production, knowing that revenue is equal to the product of price and volume:
B = P*Q,
MD for 1 unit. = P — Zper. for 1 unit
To determine the break-even point using another formula, find the marginal income coefficient (Kmd):
![]()
![]()
The final value in both formulas will be the same.
Break-even point in physical terms
The calculation formula will show the minimum sales volume to cover all production costs with zero profit. Calculated as follows:
![]()
Each subsequent unit of goods sold above this critical volume will bring profit to the enterprise.
With a known value of VERNAT. VERDEN can be calculated:
VERDEN. = VERNAT. *P
How to calculate break-even point in Excel
It is very convenient to calculate the break-even point in Microsoft Office Excel. It is easy to set the required formulas between all the data and build a table.
Table compilation procedure
First, you need to create cost and price indicators. Let's assume that fixed costs are 180 rubles, variable costs are 60 rubles, and the price for 1 unit of goods is 100 rubles.


The value in the columns will be as follows:
- We fill out the production volume ourselves, in our case we will take the interval from 0 to 20 pieces;
- Fixed costs =$D$3;
- Variable costs =A9*$D$4;
- Gross (total) costs = B9 + C9;
- Revenue (income) =A9*$D$5;
- Marginal income = E9-C9;
- Net profit (loss) = E9-C9-B9.
These formulas in cells must be carried out throughout the entire column. After filling in the values for production volume, the table will take the following form:

Starting from the 5th unit of production, net profit became positive. Before this, revenue did not cover the total (total) production costs. The profit in this case is equal to 20 rubles, that is, formally this is not quite the correct break-even point. The exact value of volume at zero profit can be calculated:
![]()
That is, the break-even point is mathematically calculated at a production volume of 4.5 units. However, the economist takes into account 5 pieces. and the revenue value is 480 rubles. is considered the break-even point, since it produces and sells 4.5 pcs. product is not possible.
Let's add 2 more columns to the table with the calculation of the safety margin (margin of safety, margin of safety) in monetary terms and in percentages (KB den. and KB%). This indicator indicates the possible amount of reduction in revenue or production volume to the break-even point. That is, how far the enterprise is from the critical volume.
Calculated using the formulas:

- Vactual (plan) – actual or planned revenue;
- VTB – revenue at the break-even point.
In this example, the actual revenue value is taken. When planning sales volume and profit, they use the value of planned revenue to calculate the required safety margin. In the table, these columns will be calculated as follows:
- Safety edge in rub. = E9-$E$14;
- Safety edge in % = H10/E10*100 (calculation is carried out starting from a production volume of 1 piece, since division by zero is prohibited).
A safety margin value above 30% is considered a safe limit. In our example, production and sale of 8 pcs. goods and more means a stable financial position of the company.
The final table will look like:

Algorithm for constructing a graph
For clarity, let's build a graph. Select Insert/Scatter Plot. The data range includes gross (total) costs, revenue, and net profit. On the horizontal axis there will be production volume in pcs. (it is selected from the values of the first column), and along the vertical – the sum of costs and revenue. The result will be three slanted lines.

The intersection of revenue and gross costs is the break-even point. It corresponds to a net profit value of 0 (in our example, 20 rubles for a product quantity of 5 pieces) horizontally and the minimum required revenue value to cover total costs vertically.
You can also build a more detailed graph, which includes, in addition to the above indicators, fixed, variable costs and marginal income. To do this, the specified rows are sequentially added to the data range.

How to use a ready-made table in Excel
To calculate the break-even point, you just need to substitute your initial data, and also enter the production volume values in the first column. If there are a lot of them, then to speed up the work you can write in cell A10, for example: =A9+1 and move this formula down. Thus, the interval between volume values will be 1 piece. (you can enter any number).
- Download a ready-made excel file to calculate the break-even point
Example of calculating the break-even point
For example, let’s take an entrepreneur selling watermelons in summer stalls. He has one product, the price is the same in different parts of the city. Watermelons are purchased in bulk in the southern regions and delivered for sale to central Russia. The business is seasonal, but stable. The initial data is as follows:
It is necessary to determine the minimum acceptable volume of watermelon sales and the threshold revenue value to cover all costs.
The procedure for calculating using the mathematical method
The price of 1 watermelon is taken as average, since they all have different weights. These fluctuations can be neglected. To calculate the break-even point in physical terms, we use the well-known formula:
To calculate the break-even point in monetary terms, you need to know the number of watermelons sold per month and the amount of variable costs for this volume:
- Q per month = 36000/250 = 144 watermelons,
- Zper. for monthly volume = 130*144 = 18,720 rub.

The first two values give a break-even point with zero profit, but the volume of watermelons sold will be 91.67 pieces, which is not entirely correct. The third value is calculated based on the critical sales volume of 92 watermelons per month.
Current monthly revenue and sales volume are above the break-even point, therefore the entrepreneur is working with a profit.
Additionally, we determine the size of the safety edge:

A level above 30% is considered acceptable, which means the business is planned correctly.
Calculation procedure by graphical method
The break-even point can also be calculated graphically, without preliminary calculations. To do this, the volume of output in pieces is plotted along the horizontal abscissa axis, and the amount of revenue and total costs (sloping lines) and fixed costs (straight line) is plotted along the vertical ordinate axis. Next, they draw by hand or build a diagram on a computer based on the original data.

As a result of constructing the graph, the break-even point will be at the intersection of the revenue and total cost lines. This corresponds to a sales volume of 91.67 watermelons and revenue of 22,916.67 rubles. The shaded areas show profit and loss areas.
The given calculation model for one product is easy to analyze and calculate the break-even point. Well suited for companies with a stable sales market without sharp price fluctuations.
However, the above calculation has the following disadvantages:
- Seasonality and possible fluctuations in demand are not taken into account;
- The market may grow due to the emergence of progressive technologies, new marketing moves;
- Feedstock prices may change;
- For regular and “large” buyers, discounts are possible.
Thus, the data for calculating the break-even point are considered in conjunction with many factors and other economic indicators.
Break-even planning for the enterprise
Based on the obtained values of the break-even point, an analysis of the current market conditions is carried out and the most significant factors influencing it are identified. Planning further work involves forecasting production costs and competitive market prices. This data is used to calculate the production and break-even plan, which is part of the company's overall financial plan. For the successful operation of the enterprise, compliance with the approved goals is monitored.
Consecutive stages of break-even planning:
- Analysis of the current state of affairs in the company and sales . Strengths and weaknesses are identified and determined taking into account internal and external factors. The work of supply and sales services, the level of management at the enterprise, and the rationality of the production process are assessed. Among external factors, the market share controlled by the company, the activities of competitors, changes in consumer demand, the political and economic situation in the country, etc. are taken into account;
- Forecast of future prices for manufactured products, taking into account the assessment of all factors from paragraph 1 . An acceptable markup range is planned. Alternative options for selling to new markets or restructuring the enterprise to produce similar products are explored in the event of an unfavorable situation in the current market;
- Fixed, variable costs and production costs are calculated . The volume of work in progress at all stages of production is planned. The need for fixed and working capital and the sources of their acquisition are formed. Additional possible expenses for loans and other obligations are also taken into account in production costs;
- The break-even point is calculated . The required size of the safety edge is determined. The more unstable external factors are, the greater the margin of safety should be. Next, the volumes of production and sales of goods at the safety edge level are calculated;
- Planning the company's pricing policy . Prices for products are determined that will allow achieving the required sales volume. The break-even point and safety margin are recalculated once again. If necessary, paragraphs 3 and 4 are repeated in order to find reserves for reducing costs in order to achieve the required safety margin values;
- Adoption of the final break-even and sales plan divided by periods . The data is approved at the critical volume point.
- Break-even control , divided into several components: control of all expense items, total cost, sales plan, receipt of payments from customers, etc. The enterprise should always have an understanding of how the current financial situation corresponds to the planned break-even level.
Calculation example for a store

Using the example of a store selling several types of goods, let’s consider a solution to a multi-product problem. These are musical instruments and related products: electric guitar (A), bass guitar (B), sound amplifier (C), acoustic guitar (D). The store has fixed costs, as well as individual variable costs for each type of product. They are purchased from different suppliers and bring in their own amount of revenue.
The initial data is as follows:
| Product | Revenue from the sale of goods, thousand rubles | Individual variable costs, thousand rubles | Fixed costs, thousand rubles |
| A | 370 | 160 | 400 |
| B | 310 | 140 | |
| IN | 240 | 115 | |
| G | 70 | 40 | |
| Total | 990 | 455 | 400 |
The store is quite large, but the structure of revenue by type of product does not change significantly. The range and prices for them are different, so it is more rational to calculate the profitability threshold in monetary terms. To solve this problem, we use formulas and methods from direct costing, which assume a range of break-even points for such a case:
![]()
Kz. lane – coefficient of the share of variable costs in revenue.
![]()
In the following table we calculate it for each type of product and the total for the entire store. We will also calculate marginal income (Revenue - individual variable costs) and its share in revenue:
| Product | Marginal income, thousand rubles | Share of marginal income in revenue | Kz. lane (share of variable costs in revenue) |
| A | 210 | 0,37 | 0,43 |
| B | 170 | 0,55 | 0,45 |
| IN | 125 | 0,52 | 0,48 |
| G | 30 | 0,43 | 0,57 |
| Total | 535 | 0,54 | 0,46 |
After calculating Kz. lane For the entire store, the average break-even point will be:
Now let's calculate this indicator using the most optimistic forecast. It is called marginal descending ordering. The table shows that the most profitable products are A and B.
Initially, the store will sell them and the total marginal income (210+170=380 thousand rubles) will almost cover the fixed costs (400 thousand rubles). The remaining 20 thousand rubles. will be received from the sale of product B. The break-even point is equal to the sum of revenue from all listed sales:
The most pessimistic sales forecast is the marginal ordering in ascending order. Initially, goods D, C and B will be sold. The marginal income from them (125+30+170=325 thousand rubles) will not be able to cover the store’s fixed costs (400 thousand rubles). The remaining amount is 75 thousand rubles. will be received from sales of product A. The break-even point will be equal to:
Thus, all three formulas gave different results. Essentially, optimistic and pessimistic forecasts provide an interval of probable break-even points for the store.
Additionally, we calculate the safety margin in monetary terms and as a percentage based on the average break-even point:

Although the store is operating at a profit, the safety margin is below 30%. Ways to improve financial performance are to reduce variable costs and increase sales for goods D and C. It is also necessary to check fixed costs in more detail. Perhaps there will be reserves for reducing them.
Example of calculation for an enterprise
As an example, let’s take an enterprise producing household solvents with a volume of 1 liter. The company is small, prices rarely change, so it is more rational to calculate the profitability threshold in physical terms (number of bottles).
The initial data is as follows:
The calculation will be as follows:
The resulting value is very close to the actual volume (3000 pcs.).
Additionally, we calculate the safety edge in pieces (using a formula similar in monetary terms) and as a percentage:

Thus, the company operates on the verge of break-even. Urgent measures are needed to improve the financial situation: a review of the structure of fixed costs, perhaps the salaries of management personnel are too high. It is worth understanding in detail the costs that form variable costs. The primary direction to reduce them is to find new suppliers of raw materials.
The break-even point reflects the volume of production, sales of goods and services, which covers all costs of the enterprise. In an economic sense, it is an indicator of a critical situation when profits and losses are zero. This indicator is expressed in quantitative or monetary units.
The lower the break-even point of production and sales volume, the higher the solvency and financial stability of the company.
Break-even point formula in Excel
There are 2 ways to calculate the break-even point in Excel:
- In monetary terms: (revenue * fixed costs) / (revenue - variable costs).
- In natural units: fixed costs / (price – average variable costs).
Attention! Variable costs are taken on a per unit basis (not total).
To find breakeven, you need to know:
Fixed costs (not dependent on the production process or sales) - rent payments, taxes, salaries for management personnel, leasing payments, etc.
Variable costs (depending on production volumes) - the cost of raw materials and materials, utility bills in production premises, workers' salaries, etc.
Selling price per unit of goods.
Let's enter the data into an Excel table:
- Find the volume of production at which the company will receive a net profit. Establish the relationship between these parameters.
- Calculate the volume of sales of goods at which the break-even point will occur.
To solve these problems, we compose the following table with formulas:
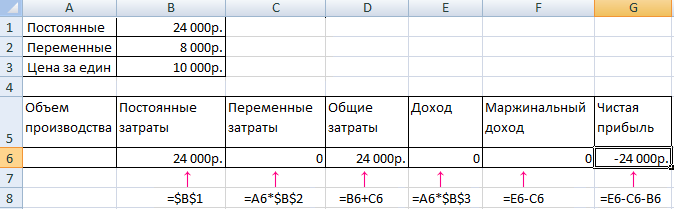
- Variable costs depend on the volume of products produced.
- Total costs are the sum of variable and fixed costs.
- Income is the product of production volume and product price.
- Contribution margin is total revenue minus variable costs.
- Net profit is income without fixed and variable production costs.
Let’s fill out the table and see at what output the enterprise will be “in the black.”

Starting from the 13th production, net profit became positive. And at the break-even point it equals zero. Production volume – 12 units of goods. And the income from sales is 120,000 rubles.
How to graph the break-even point in Excel
To clearly demonstrate the economic and financial condition of the enterprise, we will draw up a graph:
- We decide on the appearance of the graph and click the “Select data” button.
- For demonstration, we need the columns “Total Costs”, “Revenue”, “Net Profit”. These are the elements of the legend - “Rows”. We manually enter the “Row Name”. And in the “Values” line we make a link to the corresponding column with data.
- The range of horizontal axis labels is “Production Volume”.
We get a graph like:

Let's change the graph (chart layout) a little.

This demonstration allows us to see that the net profit at the break-even point is indeed “zero”. And it was after the twelfth release of the product that “plus” began.
Where are such calculations needed?
The “break-even point” indicator is in demand in economic practice to solve the following problems:
- Calculation of the optimal price for the product.
- Calculation of the amount of costs at which the company still remains competitive.
- Drawing up a product sales plan.
- Finding the volume of output at which profitability will appear.
- Analysis of the financial condition and solvency of the enterprise.
- Finding the minimum production volume.
Ready-made calculations and templates for analyzing an enterprise's break-even point.
Calculating such an indicator is important for almost any enterprise. Does it sell finished products or produce its own? After all, it is necessary to know when an open enterprise or store will recoup the money invested in it and begin to make a profit.
What is the break-even point and what does it show?
This indicator is important not only for the enterprise, but also for potential investors. After all, they first of all look at this indicator, since it is important to determine when the enterprise will begin to generate income and thereby indicate its attractiveness in investment terms. So this indicator significantly influences the decision to invest financial assets.
The break-even point shows the volume of product sales at which profit is equal to . Profit is determined by the difference in costs and revenue per unit of production.
The break-even point indicator is determined in monetary terms and in physical terms. By considering the value of this indicator, you can understand how much it will be necessary to produce products, provide services, or fulfill orders in order to cover initial costs and make zero profit. So the break-even point as a result reflects how income compares with expenses.
When this point is exceeded, the company receives a profit, and if it does not reach it, it receives fixed costs.
T.B. indicator company is necessary to determine the financial stability of the enterprise. For example, if this indicator is constantly increasing, then this is a clear signal that the company is having problems making a profit. We should not forget that T.B. may change as production or trade turnover expands. Basically, with such indicators it decreases.
To summarize, calculating such an indicator provides the following opportunities:
- Decide whether it is worth investing your money in this project if it comes after the release of several batches of products;
- Identify possible problems at the enterprise associated with constant changes in technical requirements;
- You can find out the dependence of sales volume on the price of products. In this way, you can reduce or increase sales volume depending on price changes;
- Calculate by what acceptable value it is necessary to reduce profit in order not to end up at a loss.
In addition, in large manufacturing enterprises this indicator serves as the main criterion for pricing its products. This indicator is also taken into account when deciding to introduce discounts on products.
T.B. it is also necessary to indicate in the business plans being developed about the opening of a new production facility or retail outlet.
Break-even point - how to calculate?
Before you begin calculating your break-even point, you will first need to consider your business's costs. They will need to be distributed between constants and variables. This action will affect the accuracy of subsequent calculations.
The constants include:
- Depreciation expenses (included in the cost of the product itself);
- Salaries of administration personnel (with all deductions and payments);
- Rent;
- Purchase of raw materials.
Variables include:
- Purchase and repair of components;
- Fuel and other combustible materials necessary to support the production process;
- Salaries of main workers.

Note that fixed costs cannot depend on the amount of volume and sales. In addition, these expenses will not change much over time. In order for them to change, the following points must be changed:
- Increase or decrease in production at the enterprise;
- Opening or closing of an additional department, workshop, production line;
- Increase or decrease in rent;
- High inflation.
However, they may not change at all with an increase in the volume of production. Therefore, such costs are attributed as temporarily constant per unit of goods produced.
Calculation formula
This indicator is calculated using the following formula:
T.B.=Pos.Z.? (Doh. -Per. Z.)
- T.B. - break even;
- Pos. Z. – Fixed costs;
- Ext. – Income;
- Per. Z. – Variable costs.
Using the data obtained as a result of calculation using this formula, you can obtain indicators of the critical sales volume in numerical values.
To calculate this indicator in financial terms, you must have the following expressions in the data:
- Pos. Z. – fixed costs;
- Ext. – Income;
- Per. Z. – variable costs.
To calculate this indicator in monetary format, you will need to calculate the marginal income. Contribution margin is the difference between income and variable costs. It is determined by the following formula:
M=Doh. -Per. Z.
The marginal income ratio we need is calculated using the following formula:
After calculating this indicator, you can finally begin to calculate T.B. in monetary format:
T.B. den.=Pos. Z.?KM
Using this formula, you will get the value at which your revenue will cover the costs of production needs.
In order to better understand this material, it is better to consider this indicator using an example.
Examples of break-even point calculations
For the first example, it is best to consider a clothing store, because thanks to its work, T.B. for him it is calculated only in the financial version.
For a clothing store located in a shopping center, the following items can be included in fixed expenses:
- Renting premises;
- Employee salaries;
- Insurance contributions from salary;
- Payment of utility services;
- Payment for advertising campaigns.
Our example shows that fixed costs in this store will be equal to 336,000 rubles. And his income will be about 2,300,000 rubles. So, let's calculate the marginal income:
KM =1800000?2300000= 0.78 rub.
T.B. den.=336000?0.78=430769 rub.
This indicator tells us that the store will need to sell its products in the amount of 430,769 rubles in order to achieve self-sufficiency. We can also find out that this store has a so-called capital reserve; this indicator tells how much you can reduce your income so as not to go into constant expenses.
Let's look at the second example against the backdrop of a manufacturing plant.
Basically, all enterprises that produce their products are designed to create only one type of product. Thanks to this, their costs are the most optimal. At the same time, T.B. is calculated numerically for this type of product.
The price of one produced product is 350 rubles
Let's calculate T.B. for the enterprise using the initial data:
T.B. =265000?350-280=3785
This value means how many units of product the company needs to produce in order for its costs to reach zero. If the output is large, the enterprise will begin to make its profit.
This indicator as a whole is an important criterion for further planning of possible volumes of production or sales of goods. In addition, this value gives an understanding of how large the difference is between expenses and income per unit of production. With the help of which you can better control changes in price formations.
In addition, this indicator is of paramount importance for investors, since it is by this indicator that they judge the attractiveness of investing in an idea or company.
In contact with
The break-even point shows a certain amount of money that an enterprise or brand receives as a result of its work, and at the same time it is able to cover all existing costs, namely fixed and variable.
Fixed costs do not directly depend on the quantity of products produced or services provided and include:
Dear reader! Our articles talk about typical ways to resolve legal issues, but each case is unique.
If you want to know how to solve exactly your problem - contact the online consultant form on the right or call by phone.
It's fast and free!
- remuneration, namely management;
- rental of production space and equipment;
- property taxes;
- deductions for depreciation;
- payment to security services.

Variable costs depend on the production process, the volume of products produced and services provided. These include:
- payment of utilities;
- deductions for wages of full-time workers;
- costs associated with the purchase of fuel;
- purchase of basic and component materials;
- costs of purchasing raw materials.
It should be noted that if the company fully and without any problems pays off the invoices received, then it operates without losses and has the amount of funds that is called the break-even point. It can be presented in calculations both in monetary terms and in units of sold or produced products.
Calculation options
To find the break-even point you need to follow several steps, namely:
- collecting information about production volume, quantity of products sold, the presence or absence of profits and losses;
- determining the amount of fixed and variable costs;
- calculation of the break-even point and certain safety zones;
- conclusion based on the data obtained, with the help of which you can estimate the level of sales and the optimal volume of production, which will ensure the financial stability of the company;
The analytical method involves calculating such a volume of production, the implementation of which income will cover all existing expenses, namely, profit in this case should be equal to zero. When using this method, one should take into account information on the sale of all manufactured products, that is, what was produced was sold without any leftovers.
The graphical method involves constructing a graph with two axes X and Y, on which the volume of production and revenue with variable, fixed and production costs are plotted, respectively. The point at the intersection of costs and sales revenue is called break-even.
How to calculate
Any calculations should be carried out based on the values of one period of time, for example, it could be a year, half a year, quarter, month. It is also necessary to take into account the type of activity of the institution. Let us present the formulas for the break-even point for a store, enterprise and production.
An enterprise that trades has more than 1000 units of product names in stock; therefore, to find turnover at the break-even point, accounting uses the formula:
Tb = (Z total / %R) * 100%.
Where, Z total – total costs
%R is the percentage of profitability, determined by the ratio of cost and unit price.
The search for a break-even point for an enterprise begins with determining profit using the formula:
P = V– Z DC – Z AC
Where, P – profit,
V – sales revenue,
Z post – fixed costs,
Z variable – variable costs.
Accordingly, revenue from the sale of services can be calculated using the following formula:
V = P + Z DC + Z AC
Since the profit at the break-even point is equal to zero, the revenue formula will be as follows:
V = Z DC + Z AC or
C * Tb = Z DC + Z AC * Tb.
From here, Tb in physical terms is calculated using the formula:
Tb = Z DC / (C – Z AC).
Where, C is the price per unit of the product.
And Tb in monetary terms:
Tb = V * Z DC / (V – Z AC).
Calculation example
The “Plyushka” store is a trading enterprise that sells bakery products from the “Khleb” company. The product is provided in a wide range of more than 2000 items. The average price for bakery goods is 44 rubles.
The company's established sales profitability rate is 52%. At the same time, fixed costs are equal to 48,000 rubles, and include rental payments in the amount of 25,000 rubles, for advertising - 5,000 rubles, and variable costs for staff salaries amount to 18,000 rubles.
Tb = (48000 / 52%)*100%,
Tb = 92307 rubles.
To determine the payback of the project (Op) of the store, you should divide Tb / C average, hence accordingly:
It follows from this that for effective and profitable work it will be enough if 2098 customers come to the store in a month to purchase bakery goods.
The calculation of the break-even point for the Khleb enterprise, which produces bakery products, is carried out on the basis of the proposed data. The average price for products is 36 rubles, variable costs per unit are 8 rubles, fixed costs are 120,900 rubles, 3,000 products are produced per month. Sales revenue is 108,000 rubles.
To calculate the break-even point of an enterprise, you must use the formula in monetary terms Tb = V * Z post / (V – Z variable):
Tb = 108000 * 120900 / (108000 – 24000),
Tb = 13057200000 / 84000,
Tb = 155443 rubles.
The 120,908 rubles received mean that the company will receive zero profit if it produces products for the calculated amount.
The break-even point for production will be calculated using the formula Tb = Z constant / (C – Z variable) in physical terms:
Tb = 120900 / (36 – 8),
Tb = 120900 / 28,
Tb = 4318 pieces.
Taking into account the data obtained, it should be concluded that the company needs to increase production to 4318 units; having reached this volume, the profit will be zero.
How to calculate the break-even point in Microsoft Excel
Complex and voluminous economic calculations should be carried out in Excel for convenience. To do this, just enter the appropriate formulas to get the result.
Schedule
Constructing a break-even chart is an integral part of the calculations. It clearly shows the efficiency of work, profit and loss.
Building a break-even point based on analytical calculations of a store, enterprise and production in Excel will look like this:
For enterprises, firms and other legal entities, calculating the break-even point is an important criterion for assessing their activities. Analytical data reflects the feasibility of doing business and possible adjustments in case of non-receipt of profit.
The essence of the calculations carried out is revealed when constructing a graph, which displays to a greater extent and clearly all the necessary information with the help of which it is possible to draw conclusions. This includes the volume of production, all existing costs, both in kind and in monetary terms.
Not only an economics specialist can understand the information presented on the graph. This is due to the fact that the area located above the break-even point always indicates a profit and vice versa. With this data, it is possible to make changes to production or service policies. And also in the Microsoft Excel program, it is possible to predict future changes before translating them into reality.
 Wise and insightful quotes from Sir Winston Churchill I don't wish you health and wealth
 Profession tourism manager: training features and responsibilities
 How to correctly write a resignation letter of your own free will
 Example and features of a personnel adaptation program in an organization
 The role of soil in human life What role does soil play in human life
 Expansion of staff - justification for the increase, sample memo
 Job responsibilities of line engineers