Calculate the break-even operation of the enterprise according to the following data. Methods for determining the break-even point. Calculation in Excel
The break-even point reflects the volume of production, sales of goods and services, which covers all the costs of the enterprise. In an economic sense, this is an indicator of a critical situation when profits and losses are equal to zero. This indicator is expressed in quantitative or monetary units.
The lower the break-even point of production and sales, the higher the solvency and financial stability of the company.
Break Even Point Formula in Excel
There are 2 ways to calculate the break-even point in Excel:
- In monetary terms: (revenue * fixed costs) / (revenue - variable costs).
- In natural units: fixed costs / (price - average variable costs).
Attention! Variable costs are taken per unit of output (not total).
To find breakeven, you need to know:
Fixed costs (not dependent on production process or sales) - lease payments, taxes, wage for management, leasing payments, etc.
Variable costs (depending on production volumes) - the cost of raw materials and materials, utility bills in production facilities, wages of workers, etc.
The selling price of a unit.
Enter data into an Excel spreadsheet:
- Find the volume of production at which the company will receive net profit. Establish a relationship between these parameters.
- Calculate the volume of sales of goods at which the break-even point will come.
To solve these problems, we compile the following table with formulas:
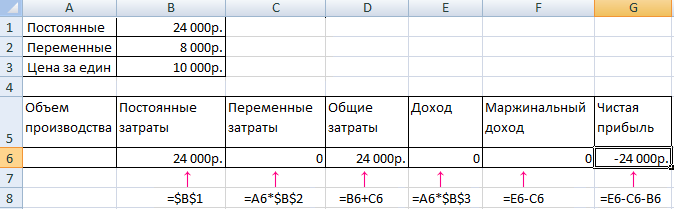
- Variable costs depend on the volume of products produced.
- The total cost is the sum of the variables and fixed costs.
- Income is the product of the volume of production and the price of a good.
- Marginal income is the total income without variable costs.
- Net profit is income without fixed and variable production costs.
Let's fill in the table and see what output the company will make a "plus" on.

Starting from the 13th production, the net profit became positive. And at the breakeven point, it is zero. The volume of production is 12 units of goods. And the income from sales is 120,000 rubles.
How to Plot a Break Even Point Chart in Excel
To demonstrate the economic and financial condition enterprises will draw up a schedule:
- Decide on appearance graph and click the "Select Data" button.
- To demonstrate, we need the columns "Total Cost", "Revenue", "Net Profit". These are the elements of the legend - "Rows". We enter manually the "Row name". And in the line "Values" we make a link to the corresponding column with data.
- The range of labels on the horizontal axis is "Production volume".
We get a graph like this:
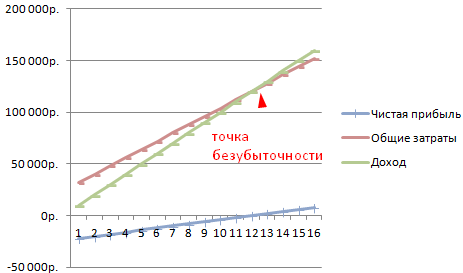
Let's change the graph (chart layout) a bit.

Such a demonstration allows you to see that the net profit at the break-even point is indeed “zero”. And it was after the twelfth release of products that “plus went”.
Where are such calculations needed?
The break-even point indicator is in demand in economic practice for solving the following problems:
- Calculation of the optimal price for the product.
- Calculation of the amount of costs at which the firm is still competitive.
- Drawing up a plan for the sale of goods.
- Finding the volume of output at which profitability will appear.
- Analysis of the financial condition and solvency of the enterprise.
- Finding the minimum production volume.
Ready-made calculations and templates for analyzing the exit of the enterprise to break even.
The threshold of profitability, or the break-even point, is the volume of products/services sold, upon reaching which the company covers all its expenses, but does not yet have a profit. With the help of this indicator, it is possible to calculate whether the chosen methods of production growth are suitable for the enterprise, how stable the course of development is.
The last parameter allows you to fix the moment of financial stability, that is, when the sales volume exceeds the minimum profitability. Next, the term "break-even point" and methods for its calculation will be considered in detail.
What is a break-even point
The break-even point is the volume of products/services sold, upon reaching which the resulting profit (not to be confused with income) becomes zero from a negative value.
Best Article of the Month
We have prepared an article that:
✩show how tracking programs help protect the company from theft;
✩ tell you what managers actually do during working hours;
✩explain how to organize surveillance of employees so as not to break the law.
With the help of the proposed tools, you will be able to control managers without reducing motivation.
Profit is calculated by subtracting all expenses from the company's income. There are two types of break-even point:
- in in kind;
- in terms of money.
The break-even point is determined to establish the amount of products / services, with the implementation of which income and expenses will become equal. Naturally, this applies to a situation where initially spending was more than income. As a consequence, once the break-even point is exceeded, the business becomes profitable. In contrast to this state, the business operates in the red as long as the equilibrium ratio has not yet been reached in the company.
The break-even point shows how stable the company's position in the financial sector. And if this value grows, then this is a sign that the company has difficulties in generating income.
At the same time, the break-even point is not fixed, its data change in relation to the growth of the enterprise. And its value is influenced by many factors - the growth of trade, the opening of new branches, changes in pricing, etc.
The break-even point, in turn, affects a number of positions in the company.
- With the correct calculation of this indicator, it is clear whether it is reasonable to invest in the project in the current state of finances.
- This parameter reveals problems in the company, which affect the change in its value.
- When establishing the break-even point and the volume of sales required by the company, it becomes clear how much it is necessary to increase or decrease the number of products sold, the scale of production, subject to a revision of their cost. In the opposite situation, it is possible, on the contrary, to reveal the influence of changes in the volume of production on price formation.
- The break-even point shows the minimum limit to which the company's profit can be reduced, but at the same time, work is still in plus, without losses.
Chart that allows you to visually see the appearance of the break-even point
Expert opinion
Fix by the end of the year 6 mistakes that prevent the company from increasing profits
Oleg Braginsky,
founder of the Troubleshooter School, director of the Braginsky Bureau
After half a year has passed, interim results are usually summed up, an analysis of the company's work, its achievements and failures is made. It must be remembered that there are still six months for the profit to grow and for the year to be profitable. But there are some mistakes or wrong actions that can prevent this from happening. The main ones can be seen in the checklist (see appendix), and the 6 main mistakes are as follows.
Mistake 1. Annoying monotonous actions.
A company can constantly do the same things - find customers only through the sales funnel, not listen to customers to create a more customer-friendly atmosphere, continue to interact with consumers through different channels instead of creating a unified one. At the same time, all departments are separated, each work on its own - and advertising, and service, and sales.
For example, in the middle of winter, a buyer came to one of the agricultural holdings in the open spaces of the b2b market to purchase fertilizer. The head of the enterprise in the process of communicating with the client, who turned out to be the director of the state farm, found out that the latter got to the holding's website thanks to the Internet. He made the purchase, and after that, the marketers of the agricultural holding began to attack him regularly, sending emails and CPs over the network and offering either tools, fertilizers, or seedlings. The client did not like it, it caused irritation, since the goods were offered unnecessary, and the fertilizers were not on time. Marketers had to take into account the information received from customers, make advertising targeted and retain this buyer.
Clients do not like it when the same actions are performed in their address with enviable regularity. To prevent this from happening to you, in the next six months, actively communicate with customers at all stages of cooperation. Otherwise, your customers will go to competitors.
A good solution would be to use the Client Journey Map (CJM). McKinsey claims that b2b firms working with CJM achieve a 10% increase in profits. CJM helps to look at the process through the eyes of the buyer, outline and apply the experience of customers. To do this, perform the following analysis:
- channels in the field of marketing that the client used at the very first contact with your company;
- what exactly did the person like on the site;
- What did the customer ask you before making a purchase?
- which of the products, services, which promotions are of interest to the client;
- what did not suit the customer during the purchase, what objections did you encounter.
Client Journey Map in translation from English is called a customer journey map and is a technology in the field of marketing that allows you to make working with consumers as simple as possible, increase their loyalty to the company, and help them interact with your company.
To obtain the data necessary to carry out all of the above, your employees must constantly note all the moments and processes of the client's contact with the company. To do this, install CRM system, set up the site and all technologies for communications:
- capture all customer information that is available;
- write down in scripts the questions that the sales employee should ask to people who applied for the first time;
- combine data about what steps the customer takes on your site with the actions of sellers working with customers who came from the sales funnel.
Thus, you will be able to see the user's journey from the moment of his first visit to the purchase. It is worth splitting customers into sectors depending on how similar their behavior is. And for each group, make a map, best of all in the form of a diagram or graph, which will show all the moments of customer contact with your company and their response. In the future, the information obtained can be used for clients with similar behavior.
This method will allow you to combine the efforts of different departments of your company, because when joint activities the marketing and sales department and their use of valuable information, the results of their work will only improve.
Mistake 2. Insufficient detailing of the buyer's portrait.
Clients in companies are usually divided into existing, former and new. But a more detailed differentiation is not carried out, plus this principle will not apply to sellers, but in vain. Consumer behavior differs not only according to these criteria, but also depending on the region in which they live, on which manager they communicate with, and at what stage of the purchase they are. And the same criteria apply to sellers. Taking into account these nuances will help maintain customer loyalty and improve service.
To solve this problem, you should proceed from the scope of your company and its mission. When setting the task of increasing sales in certain territories, it is advisable to detail the list of customers according to the following parameters:
- their location;
- what kind of purchases they make in the area;
- with which sellers they are most willing to contact and make purchases.
So the image of the client in a particular region will become clear. And already on the basis of this portrait potential buyers you can offer exactly the products that they are most likely to be interested in. At the same time, it is worth assigning to the client exactly the manager to whom he sympathizes, because this will help increase sales. In this case, the client will see that you have a quality service and that it is valued in your company.
If the company's current task is to improve the work of sales managers, then the following approach can be used. Experts should be divided into groups. For example, some of them do better with male shoppers, while others do better with female shoppers. To organize the work, incoming calls must be addressed to the administrator, who will already distribute them to the most suitable sellers, depending on the gender of consumers.
Accounting for just such information allows you to retain customers and increase sales. Therefore, it is necessary to analyze data on the behavior of buyers and sellers and choose the right managers to work with a particular customer.
Mistake 3. Not interested in the opinions of buyers.
When creating new types of products / services, the company usually focuses on its own views, and not on the wishes of customers or their needs.
That is, in most cases, no one asks for the opinions of customers and does not listen to the reviews that they voice. As a result, the company produces products that are not in demand, inconvenient for customers. Be sure to listen to the wishes of large customers. Have at least one full meeting with your most important customers.
As a solution, you can suggest at least once a year to invite the clients that bring you the maximum profit to a meeting of sorts. If this year you have not yet collected opinions and feedback from your customers for analysis, then do it as soon as possible. As an option, it is worth organizing a business weekend at a hotel in the city or traveling somewhere, make a buffet and discuss your products and services with guests, ask them to evaluate the service of your company, business development, find out their opinion about those products that you are still going to release. At this meeting, you will be able to find out the following information:
- what improvements the company needs;
- what changes to make in the goods being prepared for release;
- how much the products already on the market are needed, etc.
You can also get this information during regular customer surveys, but the fact is that big clients they like to see that they are valued according to their merits, to receive attention. Therefore, it is easier to achieve maximum loyalty from them by showing that their opinion as experts is important to you.
Mistake 4: Retaining customers that are no longer valuable.
Often in times of crisis, companies seek to keep any customers, despite the fact that they do not make a profit. Or, on the contrary, they try to attract new customers, while not trying to keep old ones. However, the flow of customers requires constant attention on your part. It is worth starting to work according to the following scheme - to leave profitable customers, and if they left, then return them, and remove unnecessary ones. Before the end of the year, you need to edit your customer base according to this principle.
The solution is to retain those consumers who regularly buy your products, who have a loyal attitude towards your company and who stand up for your brand. The customer base should be broken down into parts, highlighting the amount of the check, the frequency of purchases, the presence or absence of debt to your company.
You should stop retaining those customers whose check amount and, therefore, margin are insignificant, even if they make purchases often, or those who contact you very rarely. To do this, you can change the terms of sale to more favorable for the company. For example, increase the average purchase amount. Or change the minimum order conditions from one product to several. Loyal customers will accept these conditions, and the rest will drop out.
But if you see that customers are leaving in large numbers or that you have lost your best customers, then the situation needs to be analyzed. It is worth calling buyers from the b2b sphere to find out the reasons for dissatisfaction. If it suddenly turns out that best clients now they are cooperating with a competitor, ask why they left, what you are missing. Such a question can be asked directly to customers, as well as purchase a competitor's products for comparison. The b2b sphere allows you to return lost customers using online tools - mailing lists e-mail, organizing surveys, notifications about discounts and promotions, etc. You just need to focus on attracting buyers who can make a profit, and not be useless.
Mistake 5. Binding managers to clients.
B2B managers usually work with their own client base. At the same time, customers do not like it when the seller changes. And managers act according to an already established scheme, often forgetting to make an offer of new services or products. That is, you pay them for the fact that they simply serve a regular client.
To solve this problem, you can analyze the work of sellers over the past six months. And if it is clear that the client is buying everything the same and for the same amount as always, then assign another manager to him. Or you can motivate your employees by tying the receipt of a cash bonus to the results of their work. In this case, realizing that his remuneration depends on the amount spent by the buyer, on the quantity of goods sold, the manager will make every effort.
Mistake 6. Content is unattractive to readers.
Today, many companies use social media - blogs, networks, start their own channel on YouTube. But at the same time, the content posted by marketers is boring and uninteresting - ordinary reports, dry articles, directors' speeches, etc. That is social networks are used formally, without the purpose of attracting customers.
To solve this problem, you need to make interesting and non-standard content in order to be noticed. In doing so, three rules must be followed.
- Leadership should not appear on social media. Subscribers already subconsciously associate a speech or article from the director with boring content. And they need interesting and lively material to forward it to their friends. Therefore, the best content will be the placement of photos, entertaining and educational information.
- Serve your company's products or services in a non-standard way from an interesting angle. You can show the production process or some unusual approach to using products. It is best to come up with at least ten such ways.
- Hire actors to shoot interesting video content. Although it is more expensive, but the result is worth it. Actors will be able to speak more convincingly about the company or products than ordinary employees, they are able to convey to the audience the emotions of owning products. Plus, such content will be not only educational, but also entertaining, it will be constantly “liked” and “shared”, especially by fans of the actors and their subscribers.
The break-even point can be calculated in three ways:
1. Equation method for determining the break-even point.
The equation method is based on the fact that any report on financial result can be represented as the following equation:
Profit = Revenue - Variable Costs - Fixed Costs
P*x - (a+b*x)=0
P is the price of a unit of production;
x is the volume of production;
a - fixed costs;
b- variable costs per unit of production.
The form of this equation emphasizes that all costs are divided into those that depend on the volume of sales (variables) and those that do not depend on it (fixed).
The period for which the number of products must be produced (or sold) at the break-even point is determined by the period for which we determined the amount of fixed costs.
Using the method of the equation for determining the break-even point, it is possible to determine how much output must be achieved in order to obtain a certain, initially given amount of profit. Such a calculation is possible due to the fact that the percentage of variable costs to revenue remains unchanged.
The method of equations can also be used in the analysis of the influence structural changes in the product range. In this case, the sale is considered as a set of relative shares of products in the total amount of sales proceeds. If the structure changes, then the amount of revenue may reach a given value, and profit may be less. In these cases, the impact on profit will depend on how the assortment has changed - towards low-margin or high-margin products.
2. Method of marginal income.
Marginal income method is a variation of the equation method, the concept of marginal income is used to determine the break-even point. The value of marginal income shows the organization's contribution to covering fixed costs and making a profit.
Marginal income (MD) is the excess of sales proceeds over all variable costs associated with a given sales volume. In other words, it is the difference between sales revenue and variable costs.
There are two ways to determine the contribution margin:
- 1) MD = Sales proceeds - Variable costs;
- 2) MD = Fixed costs + Profit of the organization.
Accordingly, if we subtract fixed costs from marginal income, we get the operating profit.
Thus, in order to find the break-even point, it is necessary to answer the question: to what level should the organization's revenue fall in order for profit to become zero? Under the condition of a decrease in revenue, it is impossible to determine this indicator at the break-even point by simply adding variable and fixed costs, since with a decrease in revenue, variable costs will also decrease.
The break-even point according to this method can be defined as the point at which the difference between marginal income and fixed costs is zero, or the point at which marginal income equals fixed costs. The critical point equation for the margin approach will be the following:
Thus, the main role in the process of choosing an organization's behavior strategy is the need to pay sufficient attention to the marginal income. Obviously, it is possible to achieve an increase in profits by increasing the amount of marginal income. This can be achieved different ways: reduce the selling price and, accordingly, increase the volume of sales, increase the volume of sales and reduce the level of fixed costs, proportionally change the variables, fixed costs and output.
3) Graphical method for determining the breakeven point.
With the graphical method, finding the break-even point is reduced to building a comprehensive "costs - volume - profit" schedule. The sequence of plotting is as follows:
- 1. We determine the coordinate system for constructing a complex "cost-volume-profit" graph. The abscissa axis corresponds to the volume of production or sales of products in physical terms, and the ordinate axis, depending on the need, may reflect the indicator of revenue or total costs for the production and sale of products. The total cost is the sum of fixed and variable costs. After determining the coordinate system, we begin to build the required complex graph. To do this, draw a line of fixed costs.
- 2. Next, you should display on the graph a straight line of variable costs, which will come out of the point with coordinates (0; 0). The second point can be calculated by calculating the amount of variable costs for any sales volume.
- 3. To build a direct total costs, you should add private graphs of variable and fixed costs. This line will always start from the point where the fixed cost line intersects the y-axis, i.e. revenue axis. This point will be the first point of the direct total cost.
- 4. Next, a straight line corresponding to the value of revenue should be plotted on the complex schedule. This straight line can be constructed by finding the amount of sales revenue at any point on the x-axis. The break-even point (profitability threshold) shown on the cost-volume-profit analysis chart is the intersection point of the gross revenue and total cost charts. The amount of profit and loss is determined by profit and loss zones. At the break-even point, the revenue received by the organization is equal to its total (total) costs, while the profit is zero. The revenue corresponding to the break-even point is called the threshold revenue. The volume of production (sales) at the break-even point is called the threshold volume of production (sales).

Rice. one.
Shown in fig. 1 break-even point (profitability threshold) is point A, located at the intersection of straight lines built according to the value of gross revenue and total costs.
The amount of profit or loss is shaded. At the break-even point, the revenue received by the enterprise is equal to its total costs, while the profit is zero.
The revenue corresponding to the break-even point is called the threshold revenue. The volume of production (sales) at the break-even point is called the threshold volume of production (sales). If the company sells products less than the threshold sales volume, then it suffers losses; if more, it makes a profit.
Starting any business, you need to be prepared for the fact that the profit from the enterprise will appear, most likely, not immediately. To understand at what point all losses will be covered and income will begin to exceed expenses, you need to calculate the break-even point in advance. We will talk about this indicator in our article.
Business break-even point
The break-even point (or profitability threshold) can be defined as the volume of production (sales) at which the income from the business covers all the costs of it, that is, the company goes to "zero" - still without profit, but already without a loss, and next sales will begin to bring the long-awaited profit. AT monetary terms- this is the amount of revenue received, and in quantitative terms - the volume of products produced.
The break-even point indicator is not constant, it can increase or decrease, depending on the dynamics of the enterprise, price changes, etc.
Why is it necessary to determine the break-even point? For example, in order to:
- find out when the funds invested in the business can pay off, how effective this business project is,
- determine how financially stable the company is,
- understand how justified the planned expansion of production, sales market, branch network, etc. will be,
- to identify the minimum level of production or the amount of revenue below which the company's activities will become unprofitable.
Break-even point: how to calculate?
To calculate the break-even point, you need to understand the costs, highlighting fixed and variable costs from them:
- permanent - salary and deductions from it for administrative and managerial personnel, depreciation, office rent, etc. These expenses of the enterprise do not directly depend on the volume of production and sales, but they are affected by changes in rent, opening or closing of divisions, workshops, etc.
- variable costs depend on the volume of manufactured products (complete sales) and change along with them, increasing in proportion to the increase in production, or sales volumes - this is the piecework wages of workers and deductions from it, the cost of raw materials and materials, spare parts, etc., transportation costs, fuel, electricity, etc.
Having distributed all your costs into fixed and variable, you can begin to calculate.
Break Even Point: Calculation Formula
Depending on the specifics of the business, the break-even point can be calculated both in cash and in kind. So, for production, it will be more convenient to use the “natural” method, and for sellers of goods or services, the monetary one.
The formula for calculating the break-even point in monetary terms (TBden).
Calculate margin ratio(KMD), for which we first calculate marginal income(MD):
- MD \u003d B - Zperem,
- where B - revenue, and Zperem - variable costs for the volume of production (goods, services),
then we find the coefficient itself by dividing marginal income by revenue:
- KMD = MD / V
The amount of revenue at which the profit will be "zero", it is also the break-even point, is equal to:
- TBden \u003d Zpost / KMD,
- where Zpost are fixed costs.
An example of calculating the break-even point for a store
Break-even point - calculation formula in physical terms (TBnat).
- TBnat \u003d Zpost / (C - Zperem ed),
- where P is the price of a unit of production, goods, or services,
- Zperem ed - variable costs per unit of output.
Let's calculate the breakeven point.
Example for a manufacturing plant
Let's say the price of one product manufactured by an enterprise (C) is 450 rubles.
Fixed costs (Zpost) amount to 305,000 rubles. and include:
- salary of administrative and managerial personnel with deductions - 110,000 rubles,
- utility bills - 25,000 rubles,
- depreciation - 100,000 rubles,
- other fixed costs - 70,000 rubles.
Variable costs, with a production volume of 1000 pieces, are distributed as follows:
Let's make a calculation using the formula:
TBnat \u003d Zpost / (C - Zperem unit) \u003d 305,000 rubles. / (450 rubles - 350 rubles) \u003d 3,050 pieces, such a quantity of manufactured products will cover costs, and everything produced above the break-even point will bring profit.
What to consider when calculating the break-even point
The examples given by us are conditional and assume the immutability of the initial data. But when calculating the break-even point for an existing business, you need to take into account a number of the following factors that may affect the reliability of the result:
- the price of products, services, goods in reality does not “stand still”, but can change due to various reasons,
- if the volume of production, or sales, grows, then the costs of the company grow along with it, and not only variable, but also fixed costs can grow,
- the calculation of the break-even point is done for many types of products (goods), and not for one, which requires the calculation of the share of costs for each of them,
- purchased goods, or manufactured products are not always sold in full - unsold balances remain in the warehouse of the enterprise.
Determination of the break-even point is the cornerstone of the effective functioning of any enterprise. The calculation of this indicator is of paramount importance not only for the owners of the enterprise, but also for its investors. If the former must be aware of when output becomes profitable, then the latter must be aware of the value of this indicator in order to make an informed decision on the provision of financing.
What is the break-even point and what does it show
This indicator helps to understand when the company ceases to incur losses, but is not yet able to earn a profit. At the same time, the production and sale of any additional unit of output entails the formation of profit. Thus, the break-even point is a certain starting point, starting from which the enterprise can begin to develop effectively. Those. This indicator is a kind of indicator that the company is moving in the right direction.
This indicator is also known as profitability threshold or simply BEP(from English break-evenpoint). It characterizes the volume of output of goods at which the proceeds from its sale will be equal to the costs of its manufacture.
What is the economic meaning of determining the value of this indicator? The threshold of profitability shows the company's output to pay back its costs.
A break-even point is said to occur when expenses are covered by income. The company fixes profit when this indicator is exceeded. If this indicator is not reached, then the company incurs losses.
So, the break-even point shows:
- the level above which the company begins to record profits;
- the minimum allowable level of revenue, below which the production of products ceases to pay off;
- the minimum allowable level of pricing, below which it is impossible to fall.
In addition, the definition of this indicator allows:
- identify problems that are associated with changes in the break-even point over time;
- identify how to make it possible to change the volume of output of a product or its production with a variation in price;
- calculate how expedient it is to reduce revenue so as not to incur losses.
Determining the profitability threshold helps investors determine if it is worth financing this project subject to its payback for a given volume of sales.
Video - analysis of the break-even point:
Thus, the majority management decisions accepted only after the break-even point is calculated. This indicator helps in calculating the critical sales volume at which the company's costs become equal to the revenue from the sale of goods. Even a slight decrease in this indicator will indicate the incipient bankruptcy of the company.
Important! When the company steps over the break-even point, it will begin to take profits. Before that, it works at a loss.
Calculation formulas
The threshold of profitability can be measured in kind or in monetary terms.
In both cases, to determine the threshold of profitability, it is important to first calculate the costs of the enterprise. To do this, we introduce the concept of fixed and variable costs.
fixed costs do not change over time, and do not have a direct relationship with the volume of sales. However, they can also change under the influence of, for example, the following factors:
- changes in company performance;
- expansion of production;
- changes in the cost of rent;
- changes in general economic conditions, etc.
These include the following costs:
- payment of administrative expenses;
- rental fee;
- depreciation deductions.
variable costs are a more unstable quantity, which depends on changes in the volume of production. This type of cost includes:
- payment of wages and other deductions to workers;
- the cost of raw materials and the purchase of necessary materials;
- purchase of components and semi-finished products;
- payment for energy.
Accordingly, the amount of variable costs will be the higher, the greater the volume of production and the value of sales.
Variable costs per unit of output do not change when the volume of its production changes! They are conditionally permanent.
Having decided on the concept and types of costs, let's find out how to calculate the break-even point (BEP) in kind. For this we use the following formula:
BEP (In-kind) = Fixed Cost / (Unit Selling Price – Variable Unit Cost)
It is advisable to use this formula when the enterprise is engaged only in the production of products of one type. However, this is extremely rare. If the company produces a wide range of products, then the indicators for each of its types are calculated separately using a special extended formula.
When calculating the break-even point in monetary terms another formula is used:
BEP (in monetary terms) = (fixed costs / contribution margin) * sales revenue
For a correct calculation, we use the data on the fact of costs and revenue for the analyzed period. In this case, indicators that refer to the same analysis interval should be used.
However, the use of this formula is correct when determining BEP with marginal profit, which is positive. If it is negative, then the BEP value is defined as the sum of the fixed and variable costs that are relevant to the given period.
Video - about the importance of determining the threshold of profitability in business:
Or you can use another formula for calculating the threshold of profitability:
BEP (in monetary terms) = Fixed costs / KMD,
where KMD is the marginal profit ratio.
At the same time, KMI can be determined by dividing MA (marginal income) by revenue or by price. In turn, MD is obtained using one of the following formulas:
MD = V - PZO,
where B is revenue,
PZO - variable costs for sales volume.
MD = C - PZE,
where C is the price,
PZE - variable costs per unit of goods.
Calculation examples
For greater clarity, consider examples of calculating the break-even point using the example of an enterprise and a store.
For an industrial enterprise
Suppose we are given the following conditions. The company is engaged in the production of products of one type. At the same time, the cost of a unit of production is 50,000 rubles. Price - 100,000 rubles. Fixed costs - 200,000 rubles. It is necessary to calculate the minimum volume of goods produced, at which the enterprise will reach the threshold of profitability. Those. we need to calculate BEP in physical terms. Let's use the above formula and get:
BEP (in kind) = 200,000/(100,000-50,000) = 40 (product units).
Conclusion: thus, with the release of at least 40 units of production, the enterprise will reach the break-even point. Increasing the company's output will lead to profit.
For shop
In the following example, we will calculate the break-even point for a store. Let's say that the store is a grocery store and has the following fixed costs (in rubles):
- space rent - 80,000;
- salaries of managers - 60,000;
- insurance premiums - 18,000;
- utility bills - 10,000.
Total: 168,000 (rubles).
The conditions also contain the values of variable costs:
- payment for energy - 5,000;
- raw material costs - 10,000.
- Total: 15,000 (rubles).
Let's say that the amount of revenue is 800,000 rubles. Let's define BEP in value terms. First, let's calculate the margin. To do this, we subtract variable costs from revenue and get 800,000 - 15,000 \u003d 785,000. Then the KMD will be 785,000 / 800,000 \u003d 0.98.
Then the break-even point will be equal to fixed costs divided by the resulting coefficient, or 168,000 / 0.98 \u003d 171,429 rubles.
Conclusion: Thus, the store must sell goods in the amount of 171,429 rubles in order for income to be greater than expenses. All subsequent sales will bring the store a net profit.
Schedule
In order to find the threshold of profitability, you can use graphic method calculation of this indicator. To do this, we will reflect on the graph fixed and variable costs, as well as total (gross) costs. The break-even point graphically corresponds to the point of intersection of the curves of gross revenue and total costs.

Let's look at this with an example.
The following conditions are given (in rubles):
- the amount of revenue - 100,000;
- production output - 100 (pieces);
- fixed costs - 25000;
- variable costs - 30,000.

Having noted these data on the chart, we get the following conclusion: the company will be at the break-even point when it receives income in the amount of 35,700 rubles. Thus, if an enterprise sells goods in quantities of more than 35 units, then it will fix profits.
Calculation of the break-even point using formulas in Excel
It is very easy and convenient to calculate the profitability threshold using Excel - for this you just need to enter the initial data in the appropriate table, after which, using the programmed formulas, we will get the value of the profitability threshold for our case, both in monetary terms and in kind.
Download break-even point calculation in Excel manufacturing plant, specializing in the production of parts in the engineering industry, you can by.
The schedule and formula for calculating the break-even point in Excel for the general case are given.
The calculation of the threshold of profitability is important for the normal functioning of the enterprise. There are several methods for its determination, the optimal of which should be chosen for each specific case.
 Tires for a passenger car wholesale franchise
 What surprises the sweet tooth ice cream "33 penguins" Other benefits from the franchisor
 In honor of the opening of the new Eldorado store, Voronezh residents are waiting for a grandiose action
 Download presentation mongolia
 Presentation for the research paper "Snow and Ice"
 Castles in medieval Europe A castle is a building (or a complex of buildings) that combines residential and defensive tasks.
 Presentation on the topic of ciliary worms