How to calculate the break-even point - the formula for calculating
Many companies use different analytical methods to manage their income and expenses, including those borrowed from abroad. Among them, the simplest and most common is the CVP analysis, which provides for the assessment of the break-even point. Having learned how to make simple calculations, you can get an effective financial management system with elements of strategic planning.
Break even
Break-evenpoint (BEP)- the volume of sales at which the entrepreneur's profit is zero. Profit is the difference between income (TR - totalrevenue) and expenses (TC - totalcost). Measure it in kind or in monetary terms. It helps you determine how much products you need to sell (perform services) to cover costs. At the break-even point, income covers expenses. If it is exceeded, the company makes a profit, if it is not achieved, the company incurs losses.
Dear reader! Our articles talk about typical ways of solving legal issues, but each case is unique.
If you want to know how to solve exactly your problem - contact the online consultant form on the right or call by phone.
It's fast and free!
It is a mathematical and graphical assessment of the relationship between three main components:
- WITH- costs of the enterprise.
- Q- the number of products sold (in natural units).
- Pr- profit.
All calculations are made in order to:
- determine the physical and cost volume of sales, which will not only compensate, but also get the desired profit;
- predict what profit will be obtained if the sales volume is known;
- evaluate how profit will react to changes in price, costs or quantity of goods;
- establish the optimal structure for this type of activity.
Where to start?
You must first decide which of the costs are fixed and which are variables, since they are mandatory components for the calculation.
The main condition for conducting a CVP analysis is the division of all costs of the enterprise into two groups:
Variables(VC - Variable Сost) - costs, the volume of which changes in proportion to the growth (reduction) of the volume of production. That is, the more products you need to produce, the more you have to spend, and vice versa. These usually include raw materials and materials, semi-finished products, wages of workers, fuel and electricity for technological purposes, packaging, etc.
Average variables are calculated separately ( AVWITH- Average Variable Cost), which show the size of VC in terms of unit of production. Their size does not change over time.
Permanent(FC - Fixed Cost) - costs, the change of which does not directly depend on the growth and fall of production volumes. These are, as a rule, the costs of maintaining administrative personnel, utility bills, communications, depreciation, etc. All these costs will occur even if the company cannot produce and sell anything. In this sense, they are conditionally constant.
Calculation formula
The break-even point is calculated in two dimensions:
In natural units:
VERNAT = FC / (P - AVC) = FC x Q / (TP - VC)
Where P is the price.
This defines the minimum permissible sales volume in physical units of weight, length, volume or quantity.
In monetary units:
VERDEN = VERNAT x P
This determines the amount of revenue that will cover and receive zero profit.
There is another method for calculating the BEP in value terms. But for this you need to use the indicator marginal income / profit (MR- Marginal Profit). It characterizes the part of the proceeds that will remain after financing variable costs and will be further used to cover fixed costs and generate profit.
MP = TP - VC = FC + Pr
Average margin income will be calculated like this:
AMP = MP / Q = P - AVC
Margin income ratio - it is the share of marginal income in the company's revenue. It shows how many kopecks of profit each additional ruble of revenue will bring.
K MP = MP / TP = AMP / P
Then to calculate the break-even point in monetary terms you can use the formula:
BEP = FC / K MP
The need for calculation
Break-even analysis - an important source of information for making decisions regarding business activity:
- Should you invest in a specific project? It is important for an entrepreneur to “not burn out” and it is important to know from what moment the risk of financial failure will decrease. Based on the BEP indicator, you can calculate the volume of sales, starting from which a new business will start to make a profit, and investments will pay off.
- What does the change in BEP over time indicate? The expansion and contraction of activities directly affects the level of the tipping point. The larger the company is, the higher its BEP. But if the volume of activity has not changed, and the threshold of profitability has become higher, this can signal problems. Something goes wrong if you need to sell more than before to make a profit.
- Change the price or the volume of sales? The BEP indicator contains a linear relationship between the price and the amount of goods to be sold. On this basis, a strategic decision is made: if the selling price changes, how much should the sales volume change in order not to lose profit? Conversely, how should you adjust your pricing policy in the face of changes in the scale of sales?
- How much can you afford to reduce revenue and still break even? The BEP indicator is used to calculate the financial safety margin ( MFS- Margin of financial safety), which directly answers the question posed.
MFS = (TP - BEP) / TP x 100
MFS is defined as a percentage and allows you to compare different companies with each other. This coefficient is a kind of airbag. The higher it is, the better the company's financial position is protected from any negative changes in the market.
Calculation examples
Although all enterprises use the same formulas for calculating VEP, the industry and type of activity affects the composition of costs, as well as their division into VC and FC.
For shop
Trade enterprises have a wide range of products with different price characteristics, so it is physically impossible to calculate the critical volume for each type of goods. It is more expedient to calculate the BEP for the outlet as a whole. To do this, we will conditionally divide the costs into variable and fixed ones.
Selling goods worth over 1,012,500 rubles, the store will make a profit, and revenue below this level will plunge the outlet into losses. In this state of affairs, each additional ruble of revenue brings 40 kopecks of profit.
For the enterprise
Manufacturing enterprises that specialize in the production of homogeneous products can calculate the critical point in both natural and monetary units.
Indicator Sum
Sales volume, pcs. 10,000
Selling price, rub. 150
Revenues from sales(page 1 x page 2) 1 500 000
Variables: 1 000 000
Raw materials and supplies 800,000
Salary of basic workers with deductions of 100,000
Electricity for technological purposes 40,000
General production costs 60,000
Average variable costs (p. 4 / p. 1) 100
Marginal income(p. 3 - p. 4) 500 000
Fixed costs: 187 000
General plant costs 62,000
Depreciation and repair of equipment 25,000
Utility bills (gas, electricity, water, electricity) 30,000
Salary of management and maintenance personnel with deductions 70 00
Profit(p. 6 - p. 7) 313 000
Break-even point in natural units(p. 7 / (p. 5 - p. 2)) 3 740
Break-even point in monetary units(p. 9 x p. 2) 561 000
At this enterprise, profit is possible from a sales volume of 3,740 pieces or 561,000 rubles.
Certain calculation assumptions
The calculation is simple and universal, but it has its own conditional limitations (assumptions):
- the selling price does not grow with an increase in the volume of units sold;
- costs remain unchanged;
- products are fully sold (without residues in the warehouse and in production) in one operating cycle;
- BEP is calculated for one type of product, for which you can determine the cost price.
The limitations make the BEP indicator not an absolute, but a conditional indicator and causes criticism of many analysts.
Ver schedule
An important analysis method is visual, which implies building a break-even chart.
Since BEP is the level of activity at which revenues are equal to costs, the break-even point on the graph is formed at the intersection of two graphs: income (TR) and total costs (TC). The projection on the Q axis will show the size of BEP in physical terms, and on the TP axis - BEP in monetary terms.
Since there are fixed costs even with zero sales, the TC schedule starts from a point equal to the FC size.
Sequence of plotting:
- A graph of income is built: the first point is at 0, and the second is at the intersection of sales in natural units and the amount of revenue.
- A cost schedule is built: the first point on the vertical axis is at the level of fixed costs, and the second is at the intersection of the volume of sales in natural units and the total (fixed and variable) costs.
- BEP is marked at the intersection of the graphs as well as a profit and loss area.
CVP analysis Is an easy-to-understand and apply methodology that will enable entrepreneurs to control current costs, plan prices and volume of activities that ensure profit. Only by understanding the relationship of the main indicators, you can learn how to manage them.
 A ready-made business plan with calculations using the example of a web studio
 Registration of an internal memo: a sample document and rules for drawing up
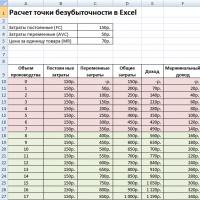 Break even. Formula. An example of calculating a model in Excel. Advantages and disadvantages
 Advance Statement is ... Advance Statement: Sample Filling
 How to sew documents by hand with threads correctly?
 Disciplinary Action for Failure to Perform Official Duties
 Binding your book