The procedure and rules for calculating the break-even point
For the development of any type of business, it is important to understand at what point, at what volume of production or sales, the company will be able to fully cover all costs, losses and start making a profit.
This level can be determined by the procedure for calculating the break-even point - the most important indicator of the effectiveness of any commercial project. The higher the volume of production and sales above this critical level, the more stable the financial position of the enterprise.
Characteristics and main indicators
The break-even point is a value that indicates the required volume of production or sales for the stable operation of an enterprise without receiving losses and profits.
 Upon reaching this point the amount of costs will be equal to the value of sales, that is, both income and expenses will be at zero. Sometimes this parameter is called the critical production volume, the threshold. In such a situation, the firm does not make a profit, and is only able to reimburse the costs.
At the same time, the break-even indicator makes it possible to calculate, how many products should be released or sold in order not to be “in the red” and work with profit. There is such addiction: if this indicator is exceeded, the organization makes a profit, if it has not yet been passed, then the production is unprofitable. This indicator reacts to many factors: changes in prices for raw materials, materials, increased turnover, expansion of the dealer network, etc.
The value of the break-even point is paramount for determining the financial stability of the company, since allows:
- see the trend of business development in general;
- assess the attractiveness of an investment project for potential investors: payback period, risk level, etc .;
- identify problems at the enterprise if this parameter changes over time;
- plan sales for a specific period;
- understand the value of income and costs in relation to adjust prices, see on which point you can reduce costs;
- calculate how much it is necessary to change the volume when the price changes and vice versa; by what value to reduce revenue so as not to slip into a loss.
Calculation algorithm
To determine this point, you need variable and fixed cost data... They must be properly separated, the difference between them must be understood. Successful entrepreneurship presupposes a competent calculation of all costs of maintaining a business.
Variable costs can consist of the cost of raw materials, materials, semi-finished products, components, energy, fuel for production, as well as the sum of all the main workers, along with other things.
They are practically impossible to calculate in advance : they depend on the nature of the enterprise, the volume of production and may change monthly. The larger the volume of production and sales, the higher the amount of costs. Average variable costs do not change depending on the volume of production.
IN fixed costs may include rental fees, depreciation charges, the amount of salaries of administrative and managerial personnel together with insurance contributions, payments on, taxes, communication costs, etc.
Such costs remain constant, they do not depend on the volume of production. However, they can be influenced by a change in the capacity of the enterprise, a changing amount of rent, inflation, etc.
Step by step mechanism for determining and applying break-even points can be represented as follows:
- Collecting data to analyze the level of production, sales of goods, expenses and income;
- Calculation of the size of all costs, break-even point and safety area;
- Assessment of the required level of production / sales for the financial stability of the company.
Calculation algorithm break-even points can be:
- analytical (using special formulas);
- graphical (assumes building a graph based on a number of base values).
If you have not registered an organization yet, then easiest This can be done using online services that will help you generate all the necessary documents for free: If you already have an organization and are thinking about how to facilitate and automate accounting and reporting, then the following online services come to the rescue, which will completely replace the accountant in your company and will save you a lot of money and time. All reports are generated automatically, signed with an electronic signature and sent automatically online. It is ideal for individual entrepreneurs or LLC on the USN, UTII, PSN, TS, OSNO.
Everything happens in a few clicks, without queues and stress. Try it and you will be surprised how easy it became!
Calculation formula
 To measure the break-even point, the following are taken indicators:
- Revenue (income).
- Fixed costs (per volume).
- Variable costs (per volume).
- Average variable costs (per unit of production).
- Price (revenue per unit of production).
- Marginal income (difference between revenue and cost of variables).
- Margin ratio (the share of marginal income in revenue is determined by dividing the costs of variables by the amount of revenue).
Calculation formula in monetary equivalent:
Break-even point = Revenue Fixed costs / (Revenue - Variable costs)
Calculation formula in in kind:
Break-even point = Fixed costs / (Price - Average variable costs)
There is also a method for determining the break-even point in monetary terms using the value marginal income:
Break-even point = Fixed costs / Margin ratio
The result of the calculation by the formulas will be the critical volume of production or sales in monetary or physical terms. Since the break-even point shows the sales volume from which the profit comes, comparing it with other indicators (such as cost, expenses, etc.), it can be used to analyze an investment project.
What are fixed and variable costs, as well as the break-even point, see the following video tutorial:
Calculation example
Clothing store
Let's calculate the break-even point for a workwear store. It is better to apply the calculation here in monetary terms because the range of goods and prices are different.
Initial data:
- Fixed costs (rent, the amount of sellers' salaries together with deductions, payment of utilities and advertising) = 250,000 rubles.
- The purchase price of the product is average = 1000 rubles.
- Sales volume = 300 units.
- Variable costs (purchase prices of products) = 300,000 rubles.
- Revenue = 600,000 rubles.
- Marginal income = Revenue - Variable costs = 600,000 - 300,000 = 300,000 rubles.
Margin ratio = Variable costs / Revenue = 0.5.
Calculation:
Break-even point = Revenue Fixed costs / (Revenue - Variable costs) = 600,000 250,000 / (600,000 - 300,000) = 500,000 rubles.
Or using another formula:
Break-even point = Fixed costs / Margin ratio = 250,000 / 0.5 = 500,000 rubles.
Thus, the store needs to be sold goods for 500,000 rubles to cover the costs and go to zero. All sales from above will be profitable.
For a metalworking enterprise
 When calculating the break-even point for a metalworking enterprise, it is better to use the formula in in kind... Small businesses often produce disposable products at roughly the same prices.
The original data:
- Fixed costs (general expenses for the enterprise, depreciation deductions, the amount of the administration's salary together with deductions) = 250,000 rubles.
- Variable costs (funds for the purchase of raw materials and semi-finished products, the amount of wages of working personnel together with deductions, fuel and technological costs) = 300,000 rubles.
- Average variable costs (per unit of production) = 300 rubles.
- Product price (revenue per unit of product) = 500 rubles.
- Production volume (planned) = 1000 units.
- Revenue = 500,000 rubles.
Calculation:
Break-even point = Fixed costs / (Price - Average variable costs) = 250,000 / (500 - 300) = 1250 pieces.
Thus, the enterprise will reach break-even points for the release of products in the amount of 1250 pieces for a certain period. This example shows that in order to reach the level without losses and profits, it is necessary to increase the volume of production by 250 pieces from the planned one. Further exceeding the volume will bring profit.
However, when calculating by default, it is recognized that with an increase in volume, the price will remain the same, costs will not increase either, and the goods will be sold in full, without residues. In reality, not everything can be so perfect.
An example of a calculation can be studied in this video:
Algorithm for plotting
When building this graph, you need do the following:
- on the horizontal axis, indicate the volume of production / sales;
- on the vertical axis, plot the values of fixed costs (straight line), variable costs (slanted line) and gross costs separately, as well as revenues.
As a result, graphs of fixed, variable and gross costs, as well as revenue, will be built. Break even located at the intersection revenue and gross cost charts. At this point, revenue and sales are threshold or critical, the company covers all costs and receives zero profit.
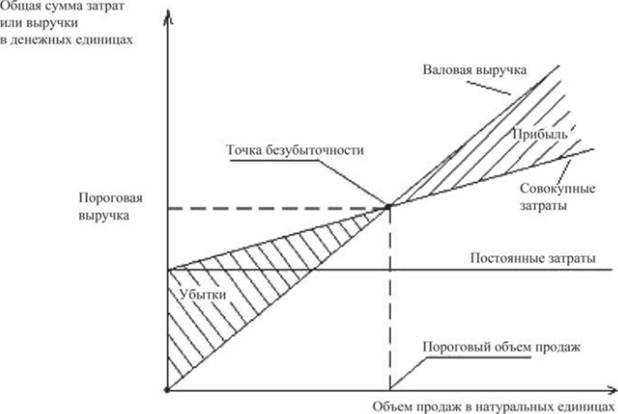
Plotting a break-even point
Break-even point chart reflects change in revenue, fixed, variable and gross costs depending on production volumes, indicated on a percentage scale horizontally.
When constructing it, it is assumed that sales occur evenly, prices for products and raw materials do not change for a given period.
Advantages and disadvantages of this analysis model
 Any aspiring entrepreneur should calculate the break-even point. This model allows you to easily see the lower limit of the financial stability of the business project, in order to take steps to increase the safety zone (distance from the critical zero profit mark). The mechanism itself for finding the threshold level of production and sales is quite simple and does not require any additional special knowledge.
However, it should be borne in mind that to determine this point, the ideal conditions of production, market and labor organization are taken. In everyday life, many hard-to-predict external factors influence product output and sales. In particular, seasonality, fluctuations in demand, increased competition, the introduction of new technologies, higher prices for raw materials, which can change the volume of sales, matter. Therefore, this model is more suitable for enterprises operating in stable market conditions.
 A ready-made business plan with calculations using the example of a web studio
 Registration of an internal memo: a sample document and rules for drawing up
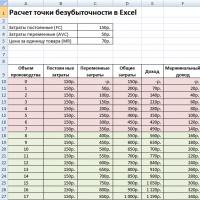 Break even. Formula. An example of calculating a model in Excel. Advantages and disadvantages
 Advance Statement is ... Advance Statement: Sample Filling
 How to sew documents by hand with threads correctly?
 Disciplinary Action for Failure to Perform Official Duties
 Binding your book