What is a break-even point: 3 ways to calculate
What is the break-even point - the theoretical aspect + data is needed to calculate it + 3 popular ways to calculate it.
It is quite difficult to plan and carry out entrepreneurial activities without knowing the basics of economics.
Any businessman, regardless of whether he or LLC, will be faced with such concepts as income, expenses and profits.
And this is generally a hundredth of what he must understand in order to successfully conduct his business.
For this reason, today we will talk about what is a breakeven point, and why is it needed?
What is a break-even point: a little theory
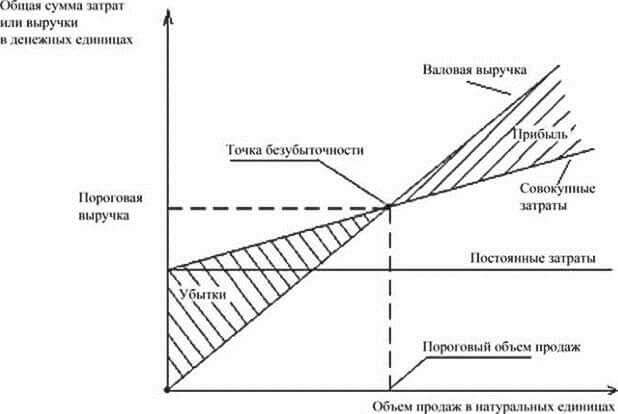
Break even point (BBU)- this is one of the key concepts in microeconomics, which shows how much you need to sell (and not just produce) goods in order to equalize income with expenses, namely, not to make a profit and not incur losses.
Thus, it is a critical indicator that predicts sales volumes to cover gross production costs.
As soon as the company crosses the threshold of profitability (this is another name for the break-even point), it begins to make a profit, and, conversely, if it is not reached, it becomes unprofitable.
The value of this indicator reacts to changes in the prices of raw materials (variable costs), the wage fund of administrative staff (fixed costs) and many other circumstances that we will analyze in the course of the article.
The importance of calculating the break-even point is due to the fact that it can be used to:
- determine the optimal cost of selling products;
- calculate how long the new project will pay off (the moment when revenues exceed costs);
- monitor changes in the indicator in order to identify problem areas in the process of production and sale of products;
- analyze the financial condition of the enterprise;
- find out how a change in price or costs will affect the resulting revenue.
Break even point - practical aspect
The next step in the analysis of the question, what is the break-even point, will be its calculation.
But before that, we suggest that you familiarize yourself with when it would be appropriate to do this:
- the amount of variable costs and cost remain unchanged over a specific period of time;
- it is possible to accurately determine not only fixed costs, but also variables per unit of output;
- variable costs and the volume of output have a linear relationship;
- the conditions for the operation of the enterprise are stable;
- there are practically no remnants of finished products (i.e., what is produced is equal to what is sold).
Required data to calculate the break-even point
To calculate the break-even point, you need to know these indicators:
| Indicator designation | Its meaning |
|---|---|
| CVP / BEP (cost-volume-profit / break-even point) | Break even |
| TFC (total fixed cost) | fixed costs |
| TVC (total variable cost) | Variable costs |
| AVC (average variable cost) | Variable costs per unit of output |
| TR (total jealousy) | Revenue (income) |
| P (price) | Selling price |
| Q | Volume of production in real terms |
| MR (marginal revenue) | marginal income |
Let's take a closer look at these indicators:
- salaries (including contributions to social funds) of management personnel;
- rental of premises;
- equipment depreciation.
Variable costs are those that depend on the quantity of products produced.
These include:
- purchase of raw materials;
- salary (plus contributions to social funds) of working personnel;
- communal payments;
- fuel and transportation costs.
- marginal income can be calculated as the difference between revenue (TR) and total variable costs (TVC) or between price (P) and unit variable costs (AVC).
fixed costs- these are those that do not depend on the volume of production, i.e. the enterprise bears them in any case.
These include:
Method 1. Using a formula.
Break even can be calculated in natural and monetary terms.
In the first case, we find out how many units of goods need to be sold in order to reach zero, and in the second, how much revenue will pay off the costs incurred.
Calculation of solid waste in kind:
BEPnat = TFC / (P-AVC)
BEPden = BEP nat * P
For clarity, consider a specific example:
Variable costs for the production of one product (AVC): 100 rubles;
Selling price (P): 180 rubles.
Substitute the original values in the formula:
BEP nat = 40,000 / (180-100) = 500 pieces.
Having the result obtained, it is possible to calculate at what gross income the enterprise will go to zero:
BEPden \u003d 500 * 180 \u003d 90,000 rubles.
Calculation of TBU in monetary terms:
BEPden = (TR* TFC) / (TR-TVC)
You can also calculate the break-even point through marginal income.
KMR for 1 unit = MR per 1 unit /P
Based on the obtained values, we obtain:
BEPden = TFC / KMR
Again, to clarify the above formulas, consider them with an example:
We have the following data:
Fixed expenses of the enterprise (TFC): 40,000 rubles;
Variable expenses (TVC): 72,000 rubles;
Revenue (TR): 120,000 rubles.
Substitute the values in the formula:
BEPden \u003d (120,000 * 40,000) / (120,000-72,000) \u003d 100,000 rubles
MR = 120,000-72,000 = 48,000 rubles
KMR = 48,000 / 120,000 = 0.4
BEPden \u003d 40,000 / 0.4 \u003d 100,000 rubles
Thus, it can be seen that the BEP values calculated by the two formulas are equal.
If an enterprise sells its goods for 100,000 rubles, then it will not suffer losses.
As for the coefficient of marginal income, it shows that each ruble of revenue received from above will bring in this case 40 kopecks of profit.
As for calculating BEP for several products, the situation is as follows:
- First, marginal revenue is calculated for each individual product.
- Then the share of marginal income in revenue and its coefficient are determined.
BEPden = TFC / (1-K TVC) ,
where K TVC is the variable cost to revenue ratio (TVC / TR ).
To make it clearer what's what, we suggest that you familiarize yourself with the table:
| Product | Revenue from the sale of goods, thousand rubles. | General variable costs, thousand rubles | Fixed expenses, thousand rubles |
|---|---|---|---|
| Total | 870 | 380 | 390 |
| 1 | 350 | 150 | 390 |
| 2 | 290 | 130 | |
| 3 | 230 | 100 |
| Product | Marginal income, thousand rubles | Share of marginal income | Variable cost ratio |
|---|---|---|---|
| Total | 490 | 0,56 | 0,44 |
| 1 | 200 | 0,57 | 0,43 |
| 2 | 160 | 0,55 | 0,45 |
| 3 | 130 | 0,57 | 0,43 |
Method 2. Using Excel.
Not to use modern technologies in economic calculations is stupid. Large enterprises that work with large quantities of several goods cannot do without them.
So, to make calculations in a popular spreadsheet, you need to enter the basic data:
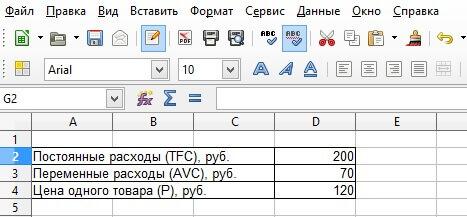
Then a table is built, which will be gradually filled with the calculated data. And already according to its results, it will be possible to see at what volume of goods sold the enterprise will pass the line of losses:
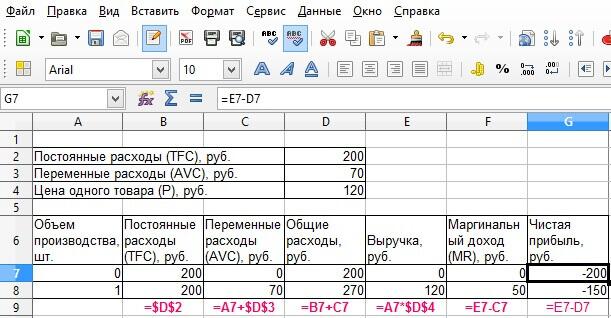
According to this principle, we fill out the table, based on the fact that the company will manufacture and sell several units of goods:
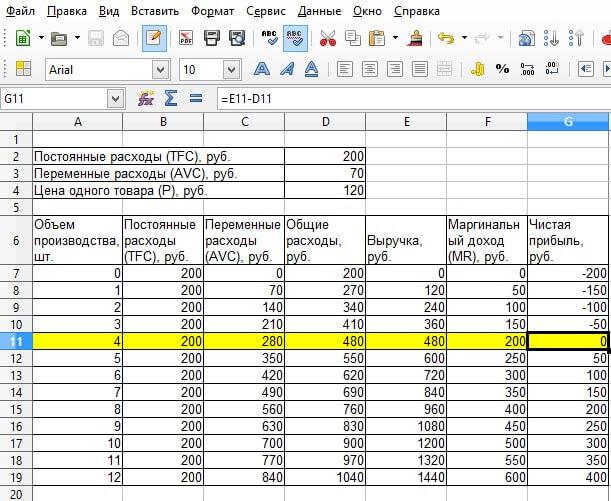
So, in our case, it turns out that when selling already 4 units of goods, the company receives zero profit. The revenue in this case will be 480 rubles.
And having already sold the fifth piece, there is a profit equal to 50 rubles.
As you can see, it is enough to build such a simple spreadsheet in which you need to enter the initial data, and the calculation of the break-even point will always be at hand.
Benefits of using Excel to calculate the break-even point:
- you can make any changes related to the price or costs - the table will instantly recalculate the results;
when forecasting, you can adjust the values of the initial indicators in order to find the optimal sales volume.
For example, you want to achieve profit already on the third unit of the product. To do this, you can immediately raise its value and see what changes.
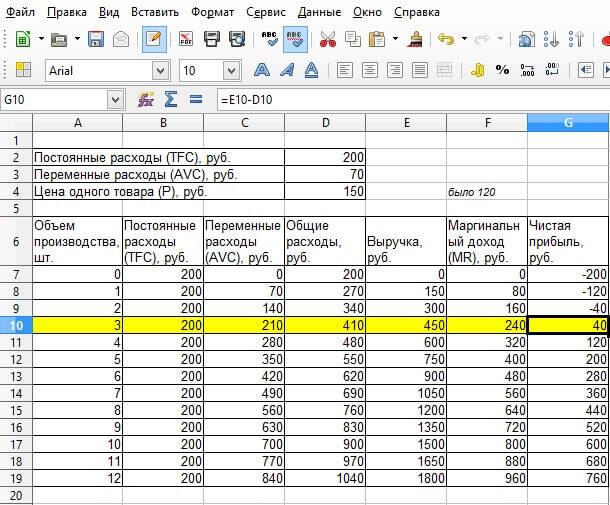
Thus, having set the price at 150 rubles, the table was immediately recalculated and issued new data, which showed the actual value of the break-even point.
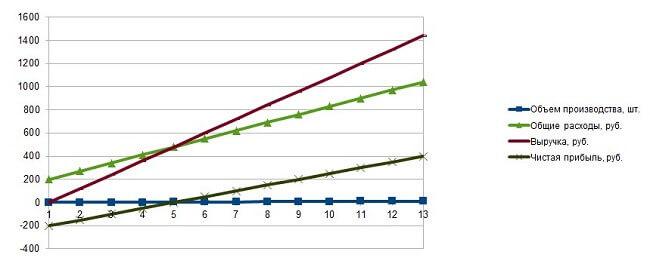
Method 3. Building a graph.
To build a graph, we need all the indicators that we calculated in the table.
For the correctness of the resulting line diagram, it is necessary to highlight the following data:
- sales volume - X axis;
- gross (fixed, variable) costs, revenue, net profit - Y-axis.
At the intersection of income and gross expenses (variables + constants) there will be a break-even point.
Lowering the perpendicular down, we find its natural value, to the left - the monetary equivalent.
Moreover, the chart clearly demonstrates the zone of losses and profits.
Let's go back to our example.
Having a table, you can easily build a graph that will show the desired indicator. Again, as changes are made, the chart will react by showing the new results.
The only disadvantage of this method is that the graph will not give the exact number of products. Of course, you can zoom in to understand what value the intersection point tends to, but still, it is the calculations that will give a specific indicator.
The calculation of the break-even point is extremely important at the stage.
Once again about how to do this, but firsthand:
Conclusions about the break-even point
Based on the above information, we can say that the break-even point:
- this is a great way to figure out how much to sell so as not to go into the red;
- it is quite simple (if you know the exact baseline);
- does not always correspond to the actual conditions of the enterprise's functioning, because its calculation implies a "utopia" in doing business (one that is not affected by anything).
But despite the fact that this indicator performs well in ideal conditions, every entrepreneur should be able to use it in analyzing the financial condition of his business.
Useful article? Don't miss out on new ones!
Enter your e-mail and receive new articles by mail
 Ready-made business plan with calculations using the example of a web studio
 Registration of an internal memorandum: sample document and drafting rules
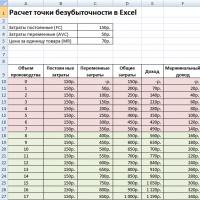 Break even. Formula. Example of model calculation in Excel. Advantages and disadvantages
 Advance report is ... Advance report: sample filling
 How to stitch documents with threads by hand?
 Disciplinary sanction for non-fulfillment of official duties
 Binding your book