Break-even chart: construction, break-even point and analysis. How to build a break-even chart for a business?
The enterprise is created in order to make a profit. Of course, large corporations will claim that "they think of us," that "we deserve it," and so on. But it all starts with profit. If it exists and is constantly increasing, the business is profitable; if it is the other way around, the enterprise is considered “burnt out”.
What do you need to know to stay in the market? What forecasting and calculation methods should be used by a novice firm? One of the simplest, but no less reliable, is the ability to build a break-even chart.
Basic concepts of enterprise sustainability
Now it is impossible to open an enterprise without thinking about when it will bring the first profit. The basics of economics, which are taught even to high school students, contain information about business planning. The most important skills of a businessman should be considered not so much the "entrepreneurial streak" as the ability to assess the risks, costs and time spent. The indicators of the sustainability of the enterprise include such basic characteristics as:
- safety margin of production;
- production acceleration levers.
A bit of history
In the early 30s of the last century, the scale of production increased quite rapidly. In the conditions of growing competition, methods for assessing entrepreneurial opportunities were needed. It was then that the methodology for estimating the critical volume of production (now known as the firm's break-even chart) appeared. Engineer Walter Rauthenstrauch proposed to correlate the volume of production with the gross costs of the enterprise. However, to optimize the company's activities, it was necessary to divide costs into fixed and variable.
Basic concepts
We can say that the success of an enterprise is based on three factors - this is the price of goods, production volume, profit. The price of a product is set by the market. The volume of production is determined by the capacity of the enterprise, and profit - by the cost of production. It sounds somewhat absurd, but the lower the gross costs, the lower the cost, which means that the difference between the market price of the goods and the cost is greater. This is profit.
Building a break-even chart just allows you to find the optimal ratio of these characteristics. Microeconomics calls such an abbreviation formed by the first letters of the words of the English language: Cost-Volume-Profit. It is important to carry out such an analysis before the start of production activities in order to avoid disappointments in the future.
One of the elements of CVP is the calculation of the volume of production at which the initial investment and operating expenses will pay off. In other words, we can say that the analysis of the break-even chart allows you to determine when the company will begin to make a profit.
What you need to know to build a graph
There are two ways to answer the question about making the first profit: determine the time (in six months, for example) or calculate the amount of products that need to be sold (1000 pieces of goods). In both cases, they talk about the calculation of the break-even point. This is a situation in which the sum of all costs of the enterprise, including the initial investment, will be equal to the income from units sold at the market price.

How to build a breakeven chart? To get started, you need the following data:
- Fixed costs are costs that do not depend on the volume of production. The formulas use the abbreviation TFC (total fixed cost). When it comes to new projects, the fixed costs are the initial investment.
- Variable costs are the production costs of producing a product. They are abbreviated as TVC (total variable cost).
The market price of a unit of production. It is denoted by the Latin letter P (price).
Required Assumptions
In practice, it is only possible to say that the moment of production coincides with the moment of sale in the service sector. This is where the hairdresser sells his skill in the form of a client's haircut, the chef prepares the salad only after the visitor has ordered it, etc. Therefore, in order to build a break-even chart, several reservations must be made:
- the moment of production of goods coincides in time with the moment of its sale;
- the consumption rates for the production of a unit of goods, as well as the cost of consumables and raw materials, are unchanged for the calculation period;
- fix the retail price as well;
- determine the dependence of revenue on the volume of output as a linear function.
How to Calculate the Break Even Point
Actually, the formula for determining the required volume of output looks like this:
BEPunits = TFC / (P-VC).
If the received quantity of goods produced is divided by the rate of output per day, we get the time for which the project will pay off. It should be remembered that there are no more than 22 working days in a month. For convenience of calculations, the duration of the month is usually taken to be 20 days.
Let's give a simple calculation example. It is necessary to invest 20 thousand den. units At 25 den. units can be adjusted at a price of 50 den. units Simple calculations give 800 units of production units (BEPunits = 20000 / (50-25) = 800 units). Having determined that 5 units of production can be produced per day, we get that it takes 160 working days in order to start making a profit. It remains only to determine the amount of income required to reach the break-even point. We multiply the calculated output by (800 * 50) and get 4000 den. units
Analytical value of the break-even chart
Business planning involves identifying risks that can nullify all business activities. The break-even chart turns out to be one of the methods for their forecasting and analysis. To do this, it is necessary to consider the activities of the company within a certain time period.

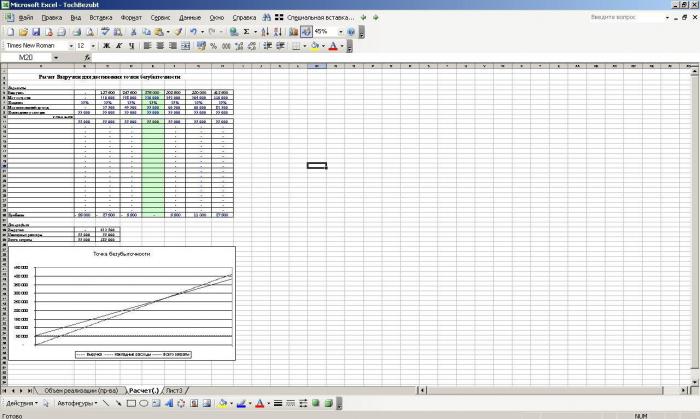
In this case, fixed costs include not costs that are independent of output volumes: payments for insurance and loans, payment for production premises (if it is a lease), etc. If an enterprise produces more than one type of product, but in the modern world to survive with such product portfolio is impossible, it is necessary to make calculations for all types of goods. In this case, you need to build a break-even chart in Excel. This will significantly reduce the time spent. Having built all the graphs on the same plane, analysts can determine which product is really successfully sold on the market, and which one is a burden for the enterprise.
For the distribution of fixed costs, the share of each group of goods in the total volume is determined. Fixed costs are distributed according to the proportion drawn up.
Margin of financial strength
If built defined. This means that it is possible to calculate the margin of financial strength of the enterprise. It determines how much a firm can painlessly reduce its output. For calculations, the difference between the sales proceeds and the break-even point, referred to the proceeds, is used. The resulting characteristic determines the percentage of output of goods by which production volumes can be reduced.
It should be noted that the obtained strength value is not an accurate characteristic. The matter is that in a portfolio of the enterprise there are both "successful" products, and "lagging behind". By reducing the production of "successful" by the maximum possible number, you can get a negative result of the firm.
Production leverage
What else can you learn if you calculate the break-even chart? Cost and revenue data can be used to determine operating leverage. This characteristic shows the percentage change in profit with an increase in production by 1%. To calculate, it is necessary to divide the margin between the received revenue and production costs by the same margin, previously reduced by the amount of fixed costs. This indicator can change over time, so it is necessary to clearly define the time period.
Settlements for trading
How to build a break-even chart for a store that sells multiple product groups? Even when using software, the plane with graphs will be so busy that the analyst will need time to “decipher” the result. For an approximate estimate of the break-even point, you can use the following formula:
BEPincome = TFC*(100/i).
Index i determines the average trade margin.
Plotting
Most people perceive the graphical representation of information better. To determine the break-even point, you can draw a break-even chart in Excel. The vertical axis usually defines money (revenue, costs, price, etc.). The horizontal axis characterizes the units of production (sometimes - time).
Elementary knowledge in the field of mathematics tells us that the schedule of fixed costs is a straight line parallel to the horizontal axis; the variable cost graph leaves the origin of the coordinate axes. Similarly, the graph of income generation comes out of the beginning of the countdown. To determine the break-even point, it is necessary to build a graph of the total. This line will run parallel to variable costs, but its beginning lies on the vertical axis at the level of fixed costs.
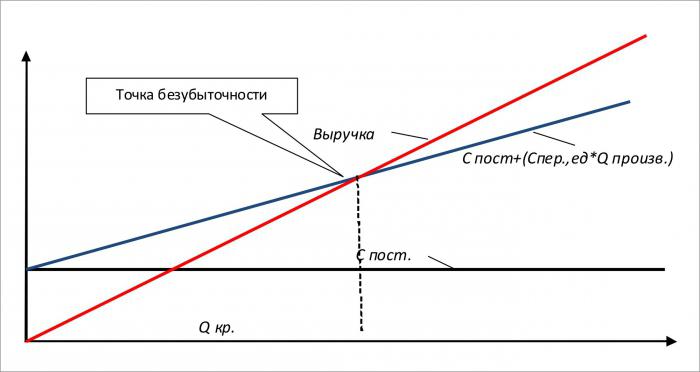
The point at which the gross cost schedule intersects with the revenue schedule defines the break-even point of production.
 Ready-made business plan with calculations using the example of a web studio
 Registration of an internal memorandum: sample document and drafting rules
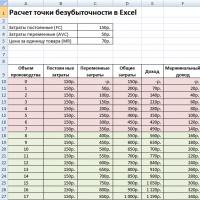 Break even. Formula. Example of model calculation in Excel. Advantages and disadvantages
 Advance report is ... Advance report: sample filling
 How to stitch documents with threads by hand?
 Disciplinary sanction for non-fulfillment of official duties
 Binding your book