Break even point chart: how to build
Any businessman tries to determine when his company will stop making losses, but will start earning by working off the funds invested in it. The break-even point is a good tool for those who want to see the ratio of income and expenses of the enterprise. For a better understanding, you can build a break-even point chart, which will clearly show how much revenue, fixed and variable costs are growing, and also see in what period cash flows will become positive.
Determination of the break-even point
This parameter shows how much product a company needs to produce in order to cover all its costs at a certain price, while entrepreneurial profit should be equal to zero.
If the company sells more goods, then it will make a profit. In the case when the number of products sold is below the break-even point, the entrepreneur operates at a loss.
Natural Parameter Expression
The calculation can be made in two ways: in monetary terms and in kind. This indicator in monetary terms has a second name - the profitability threshold - the total revenue of the enterprise, which covers the total costs. It is often used to evaluate the performance of family farming enterprises. Also, thanks to the profitability threshold, you can calculate the minimum price at which all costs will be fully covered.
In order to determine the quantity of products produced by the company, you should use indicators of total and variable costs, as well as prices. If you build a break-even point chart, then the price can be missed and replaced by revenue.
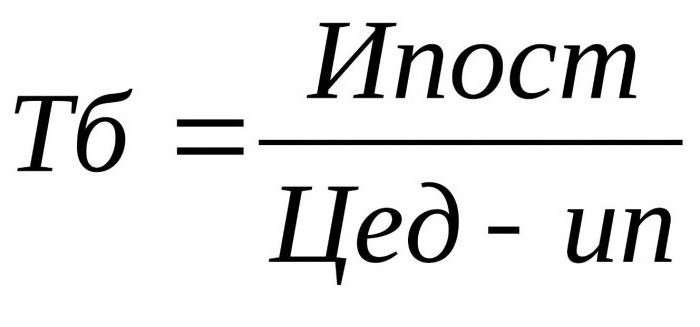
Let's imagine that the total fixed costs are Hypost; variables by 1 unit. products - IP; cost of 1 unit - Tsed. Then the formula will take the following form: Hypost / (Tsed-Ip).
The difference between the variable cost per unit of output and the price is called marginal income per unit of output.
Profitability threshold
The calculation of the profitability threshold is more complicated than the break-even points in physical terms. To calculate this indicator, you should take into account fixed costs (TFC), revenue (R) and total variable costs (TVC). The difference between revenue and variable costs is marginal revenue (MR).
Using these indicators, it is necessary to determine the marginal income ratio (KMR) - the ratio of marginal income to revenue. The threshold of profitability is the ratio of total costs to the marginal income ratio - TFC / KMR. In some cases, it is more convenient to avoid calculating this coefficient. Then the formula can be represented as follows: TFC* P / MR.
breakeven point chart
The importance of the break-even point in planning firms cannot be overestimated, since its increase can mean difficulties in making a profit. It is important to note that the value of the parameter will change not only due to an increase in costs or product prices, but also in the case of expansion of production. In order to see in more detail the relationship between costs and production volume, it is necessary to plot the break-even point. It is actively used in the modern economy.
To understand how to plot a break-even point chart on your own, you should first of all try to delve into the theory and comprehend what factors affect this value.
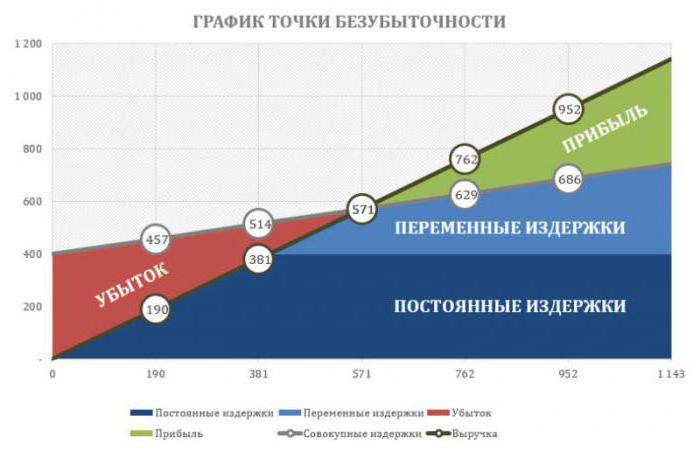
The x-axis should display the number of goods sold. The revenue of the enterprise is reflected on the ordinate axis. Next, you should depict the graphs of variable and fixed costs. The size of fixed costs does not change depending on the number of sales and products sold, so their graph will be represented by a line parallel to the x-axis. The sum of variable costs is proportionally dependent on the size of sales, so this type of cost is shown as a straight line that leaves point 0 and grows along with an increase in the number of output.
On the break-even point chart, you need to reflect the total costs. To do this, you need to sum up the variable and fixed costs. Therefore, on the chart, the break-even points are displayed as a line parallel to variable costs. It, in turn, originates where the fixed costs.
The last step in plotting is to show the company's income line. On the graph, the break-even point is where revenue crosses the total cost line. The economic meaning of the break-even point is revenue at which profit is zero or revenue that can cover all fixed and variable costs of the company.
break even point chart in excel
In our time, few people are engaged in the calculation of the break-even point on a calculator at a professional level. This can be done in Excel. It also allows you to create a chart.
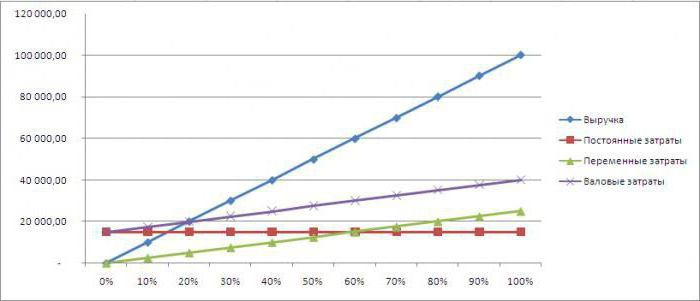
To do this, you need to paint the revenue and total costs for different volumes of production. Then you should calculate the desired indicator. In order to build a graph, you should select all the above mentioned data, and then create the desired chart (Insert / Charts / Graph). For clarity, it is better to use a chart with markers.
 Ready-made business plan with calculations using the example of a web studio
 Registration of an internal memorandum: sample document and drafting rules
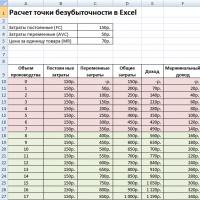 Break even. Formula. Example of model calculation in Excel. Advantages and disadvantages
 Advance report is ... Advance report: sample filling
 How to stitch documents with threads by hand?
 Disciplinary sanction for non-fulfillment of official duties
 Binding your book