How to build a break-even chart: step by step instructions. Enterprise economy
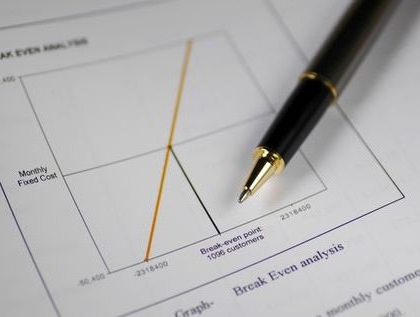
It is known that the release of products implies an investment in its production and sale. Each entrepreneur, intending to create a good, pursues the goal - this is to make a profit from the sale of goods / services. The break-even chart helps to see in value and in-kind terms the revenue and volume of production at which profit is zero, but all costs have already been covered. Accordingly, having stepped over the break-even point, each subsequent sold unit of the good begins to bring profit to the enterprise.
Graph Data
To draw up sequential actions and get an answer to the question: “How to build a break-even chart?” requires an understanding of all the ingredients needed to create a functional dependency.
All expenses of the firm for the sale of products are gross costs. The division of costs into fixed and variable allows you to plan profit and underlies the definition of critical volume.
Premises rent, insurance premiums, depreciation of equipment, wages, management are components of fixed costs. They are united by one condition: all the listed costs are paid regardless of production volumes.
The purchase of raw materials, transportation costs, wages of production personnel are elements of variable costs, the amount of which is determined by the volume of the good produced.
Revenue is also the initial information for finding the break-even point and is expressed as the product of sales volume and price.
Analytical method
There are several ways to determine the critical volume. The break-even point can also be found by the analytical method, that is, through the formula. A schedule is not required in this case.
Profit = Revenue - (Fixed Costs + Variable Costs * Volume)
The definition of break-even is performed on the condition that the profit is zero. Revenue is the product of sales volume and price. This results in a new expression:
0 = Volume*Price - (Fixed Costs + Variables * Volume),
After elementary mathematical procedures, the output is the formula:
Volume = Fixed Costs / (Price - Variable Costs).
After substituting the initial data into the resulting expression, the volume that covers all the costs of the realized good is determined. You can go from the opposite, setting the profit not zero, but the target, that is, the one that the entrepreneur plans to receive, and find the volume of production.
Graphic method
To predict the main indicators of the enterprise, given the constant conditions in the market, such an economic tool as a break-even chart is capable. Basic steps:
- The dependence of sales volumes on revenues and costs is constructed, where the X-axis reflects data on volume in physical terms, and Y-revenue, costs in monetary terms.
- A straight line is constructed in the resulting system, parallel to the X axis and corresponding to fixed costs.
- Postponed coordinates corresponding to variable costs. The straight line goes up and starts from zero.
- A straight line of gross costs is plotted on the graph. It is parallel to the variables and takes its origin along the y-axis from the point from which the construction of fixed costs began.
- Construction in the system (X, Y) of a straight line characterizing the revenue of the analyzed period. The revenue is calculated on the condition that the price of products does not change during this period and the release is made evenly.
The intersection of direct revenue and gross expenses, projected onto the X axis, is the desired value - the break-even point. An example chart will be discussed below.
Example: how to plot a break-even chart?
An example of constructing a functional dependence of sales volumes on revenue and costs will be produced using the Excel program.
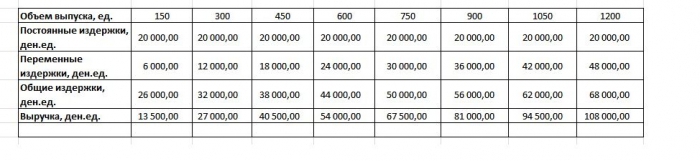
The first thing to do is to bring the data on revenue, costs and sales volumes into a single table.
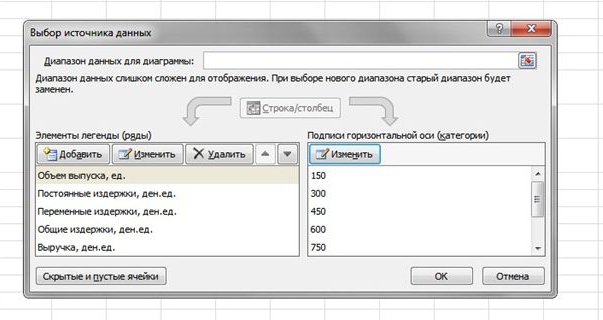
Next, you should call the "Chart with Markers" function through the toolbar using the "Insert" tab. An empty window will appear, with the right mouse button a data range is selected, which includes the cells of the entire table. Changes the x-axis label through the selection of output related data. After that, in the left column of the "Data source selection" window, you can delete the output volume, since it coincides with the X axis. An example is shown in the figure.
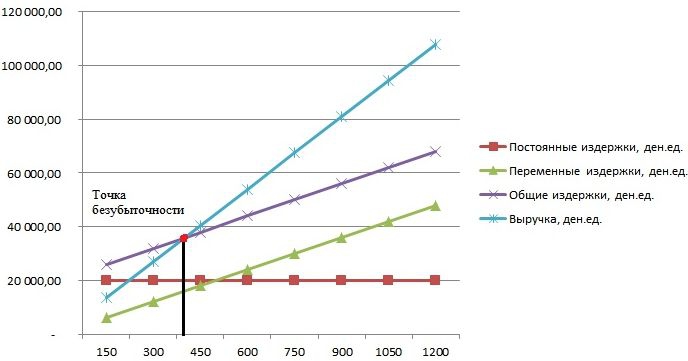
If we project the point of intersection of direct revenue and gross costs on the abscissa axis, then the volume of approximately 400 units is clearly determined, which characterizes the break-even of the enterprise. That is, having sold more than 400 units of production, the company begins to work in plus, receiving revenue.
Formula Example
The initial data of the task are taken from the table in Excel. It is known that the production of products is cyclical and amounts to 150 units. The output corresponds to: fixed costs - 20,000 monetary units; variable expenses - 6000 den. units; revenue - 13,500 den. units It is necessary to calculate break-even.
- Determination of variable costs for the production of one unit: 6000 / 150 = 40 den. units
- The price of one realizable good: 13,500 / 150 = 90 den. units
- In physical terms, the critical volume is: 20,000 / (90 - 40) = 400 units.
- In value terms, or revenue with this volume: 400 * 90 = 36,000 den. units
The break-even schedule and the formula led to a single solution to the problem - to determine the minimum volume of production that covers the cost of output. Answer: 400 units must be produced in order to cover all costs, while the revenue will be 36,000.00 den. units
Construction restrictions and conditions
The simplicity of assessing the level of sales at which the costs of selling products are reimbursed is achieved through a number of assumptions made for the availability of the model. It is believed that production and market conditions are ideal (and this is far from reality). The following conditions are accepted:
- Linear relationship between output and costs.
- The entire volume produced is equal to the volume sold. There are no stocks of finished goods.
- The prices of goods do not change, and neither do variable costs.
- No capital expenditures associated with the purchase of equipment and the start of production.
- A specific time period is assumed, during which the amount of fixed costs does not change.
Due to the above conditions, the break-even point, an example of which was considered, is considered a theoretical value in the projection of the classical model. In practice, calculations for multi-product production are much more complicated.
Model Disadvantages
- The volume of sales is equal to the volume of production and both values change linearly. Not taken into account: the behavior of buyers, new competitors, the seasonality of the release, that is, all the conditions that affect demand. New technologies, equipment, innovations, etc. are also not taken into account when calculating output volumes.
- Finding a break-even position is applicable for markets with stable demand and low levels of competition.
- Inflation, which may affect the cost of raw materials, rent, is not taken into account when setting one product price for the period of the break-even analysis.
- The model is inappropriate in its application by small enterprises, in which the sale of products is unstable.
Practical use of the break-even point
After the specialists of the enterprise, economists and analysts, have made calculations and built a break-even chart, external and internal users draw information to make a decision on the further development of the company and investment.

The main purposes of using the model:
- Calculation of the price of products.
- Determining the volume of output that ensures the profitability of the enterprise.
- Determination of the level of solvency and financial reliability. The further the output is from the breakeven point, the higher the margin of financial safety.
- Investors and creditors - assessment of the effectiveness of the development and solvency of the company.
 Ready-made business plan with calculations using the example of a web studio
 Registration of an internal memorandum: sample document and drafting rules
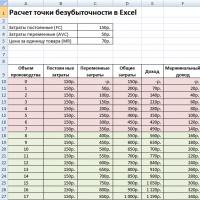 Break even. Formula. Example of model calculation in Excel. Advantages and disadvantages
 Advance report is ... Advance report: sample filling
 How to stitch documents with threads by hand?
 Disciplinary sanction for non-fulfillment of official duties
 Binding your book