How to calculate the break-even point: to help entrepreneurs
Alexander Kaptsov
Reading time: 14 minutes
A A
Business activity of any scale involves making a profit. It is important for entrepreneurs to understand how long the company will reach the level of real income. This is where the need to calculate the break-even point arises? What is this indicator? How to define it? What problems entrepreneurs face when calculating and analyzing the break-even point, read on the website
What does the breakeven point show? Definition and meaning
In the economic sense, the break-even point is the income of a business organization, at which the net profit indicator will be zero. In other words, the amount of revenue covers all expenses of the enterprise, both fixed and variable. To reach the break-even point means to recoup the total costs of the enterprise. Consequently, the further activity of the company (and its subsequent implementation) will receive the status of profitable. As they say: the company will start to work in plus.
What does a break-even indicator show to a businessman:
- How much should be the receipt on the account of the company to start a truly profitable business. What is the threshold of profitability in terms of money. A conditional example, 100 rubles of income is work to zero, and starting from 101 rubles, the company is in profit.
- What is the minimum sales volume . You can’t go lower, otherwise you won’t be able to recoup production.
- Indirectly indicates the minimum selling price . It becomes clear below which bar it makes no sense to sell products.
The break-even indicator plays a major role in the planned investment. It reflects the effectiveness of the proposed project: payback time, degree of risk. Based on calculations, a business person can always determine whether this investment option is profitable for him or not to participate in a risky venture.
What indicators are involved in calculating the break-even point?
When calculating the threshold beyond which real profit begins, it is necessary to determine the types of costs.
They are:
1.Permanent - independent of how much product is produced and how much of the finished product is sold. This expense can change with an increase / decrease in production capacity, a change in rent, in the process of depreciation of the ruble or inflation, with a decrease (increase) in production areas.
- Rent payment.
- depreciation deductions.
- The salaries of staff from among administrators-managers (including deductions).
- Utility payments.
- Other expenses that do not change from month to month.
2. Variables - depending on the volume of products produced. In essence, they increase as the volume of goods produced and, consequently, sales increase. And in the same way, they decrease.
Among the variable (changing) costs:
- The whole range of materials, components, blanks.
- Fuel and energy costs used in terms of production needs.
- Earnings of workers with all deductions and so on.
Attention . If we consider the value of changing costs relative to one piece of production, then the production volume cannot affect this parameter. In this aspect, the value is conditionally constant.
Knowing the amount of expenses, the cost of goods sold, sales revenue and, of course, a special formula, it is easy to calculate the break-even threshold (profitability point).
How to determine the break-even point: methods of determination and calculation formula
The value under consideration can be calculated using two formulas. The result of the first will be a natural value (goods in pieces), the result of the second will be a value expression.
1. The formula for calculating the profitability point (BER) in units of output:
BER = FC / (P - AVC), Where
FC- the amount of fixed costs.
R- price per piece of the finished product (service or work performed).
AVC- the size of the changing costs required for a unit of goods.
BER- in-kind admissible volume of realization.
2. The formula for calculating the break-even threshold (BER), expressed in the amount of money
In this case, it is necessary to start with the calculation of a special indicator that reflects the income of a marginal nature, that is, showing what is the share of the margin in the income received.
How is the contribution margin (MR) determined?
MR = TR - VC, Where
TR- revenue indicator.
VC- the amount of variable costs.
P=TR/Q
Q is the volume of sales.
Thus, the margin type income ratio (KMR) will be:
KMR=MR/P
The formula for calculating the break even threshold (BER) looks like this:
BER=FC/KMR
Outcome ( BER) is equal to the size of the critical revenue. If it is less, losses begin.
Of course, illustrative examples will bring greater clarity to the understanding of the calculations of the point beyond which the company begins to work "in plus".
How to calculate the break-even point of a manufacturing enterprise?
Businesses tend to do. Its price is about the same, which is not surprising, because this is a direct way to reduce costs. That is why in this case it is advisable to calculate the break-even threshold based on natural expressions.
For example, the cost of one manufactured product is 420 rubles.
The list of costs is given in the table:
| Name of permanent expenses | The name of the variable costs required to manufacture a unit of the finished product | Unit cost, in rubles | |
| Factory type consumption | 82 000 | materials | 155 |
| Depreciation type of deductions | 110 000 | Blanks | 92 |
| Salary of the administrative and managerial apparatus | 110 000 | Worker earnings | 65 |
| Communal payments | 25 000 | 22 | |
| Total | 327 000 | 334 |
Profit point calculation:
BER= 327,000 / (420-327) = 3,516 pieces
Consequently, the break-even of the enterprise is ensured by the production and sale of 3,516 pieces of finished products. If this volume is exceeded, the company makes a profit.
An example of calculating the break-even point in trading
Taking into account the specifics of the trading sector - the breadth of the range and the variety of prices - it is not advisable to make calculations of the break-even threshold in units of goods. Therefore, the result of calculations is always a monetary expression. For clarity, we use the example of a children's clothing store.
His expenses in the table:
| Name of permanent expenses | Amount of fixed expenses, in rubles | Name of variable costs | Amount of variable costs, in rubles |
| Payment for the rent of the premises | 115 000 | Purchase price of one unit (average) | 1 100 |
| Sellers salary | 135 000 | The value of the planned sales volume | 650 units |
| The amount of deductions from the accrued salary (approximately 30%) | 45 000 | ||
| Communal payments | 20 000 | ||
| Advertising expenses | 30 000 | ||
| Total | 345 000 | 715 000 |
This means that 345,000 rubles are constantly spent, the pen value is 2,800,000 rubles, with variable expenses of 715,000 rubles.
The amount of marginal income is equal to:
MR\u003d 2,800,000 - 715,000 \u003d 2,085,000 rubles
KMR = 2 085 000 / 2 800 000 = 0,75
Now you can start calculating the breakeven threshold:
BER= 345,000 / 0.75 = 460,000 rubles
What does the calculation result say? To work with zero profit, a store needs to sell clothes in the amount of 460,000 rubles. Above this threshold, profitable trading begins.
An interesting indicator of marginal income. It characterizes financial strength, or rather its stock. In this version, it is 2,085,000 rubles. It is by this figure that the decrease in revenue is allowed. A larger decline in revenue will pull the store into a loss zone.
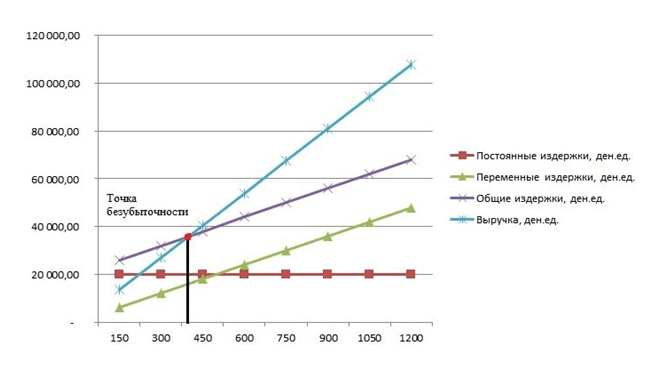
How to plot a breakeven point chart?
Using the graphical method, a forecast is made of the main indicators of the company's performance under unchanged market conditions.
The graph shows the dependence of the goods sold on the proceeds and expenses:
- X axis reflects information related to sales volumes in pieces.
- Y-axis shows revenue and expenses in rubles.
When plotting a graph in the XY system, 4 lines are built:
- Direct fixed cost runs parallel to the abscissa axis - they are unchanged.
- Variable cost line starts at zero and goes up.
- General expenses line runs parallel to variable costs, but originates at a point on the Y-axis, that is, its beginning corresponds to the beginning of fixed costs.
- revenue line in the analyzed period implies the constancy of prices in a given period of time and uniform output.
 Ready-made business plan with calculations using the example of a web studio
 Registration of an internal memorandum: sample document and drafting rules
 Break even. Formula. Example of model calculation in Excel. Advantages and disadvantages
 Advance report is ... Advance report: sample filling
 How to stitch documents with threads by hand?
 Disciplinary sanction for non-fulfillment of official duties
 Binding your book