Break-even point - what is it and how to calculate, formulas and graphs + examples and an Excel file for calculation
Hello! Today we will talk about the break-even point and how to calculate it.
Any person who decides, first of all, thinks about how and make a profit. When doing business, there are production costs - these are all the costs of manufacturing and marketing products. They are subtracted from the total sales revenue in monetary terms, getting a positive (profit) or negative (loss) result. For the successful functioning of the enterprise, it is necessary to know the border of the transition of revenue to profit. This is the breakeven point.
What is a break-even point
The volume of production at which all income received can only cover total costs - this is the breakeven point(from English break-even point - point of critical volume).
That is, this is such a minimum amount of revenue in monetary terms or the volume of production produced and sold in quantitative terms, which compensates only for all production costs.
Reaching this point means that the company is not operating at a loss, but still not making a profit. The result of the activity is zero. With each subsequent unit of goods sold, the company makes a profit. Other names for this term: profitability threshold, critical production volume.
Why you need to know the break-even point
The value of this indicator is important for assessing the current financial condition of the enterprise, as well as for economic planning for the future. The breakeven point allows you to:
- Determine the feasibility of expanding production, dealer network, mastering new technologies and types of products;
- Assess solvency and financial stability, which is important for company owners, investors and creditors;
- Track the change in the indicator in dynamics and identify bottlenecks in the production process;
- Calculate and plan a sales plan;
- Determine the allowable amount of revenue reduction or the number of units sold, so as not to go to a loss;
- Calculate the impact of price changes, production costs and sales volume on the financial result.
What data is needed to calculate the break-even point
![]()
To correctly calculate the indicator, it is necessary to understand the difference between fixed and variable costs.
And also know the following information:
- The price of 1 unit of products or services (P);
- The volume of produced and sold (in the classical calculation model) products in physical terms (Q);
- Revenue from products sold (B). To calculate the threshold in physical terms, this indicator is optional;
- Fixed costs (Zpost.) - These are production costs that do not depend on the volume of production. For a long time they do not change.
These include:
- Salary and insurance premiums for engineering and technical workers and management personnel;
- Rent for buildings, structures;
- tax deductions;
- Depreciation deductions;
- Payments on loans, leasing and other obligations.
5. variable costs(Zper) is the cost of production, which increases or decreases depending on the increase or decrease in the production of goods or the volume of services provided. The value of the indicator can vary widely, instantly responding to any changes in the company's activities.
These costs include:
- The cost of raw materials, components, spare parts, semi-finished products;
- Salary and insurance contributions of the main production workers and personnel working on piecework wages;
- Electricity, fuels and lubricants (POL), fuel;
- Fare.
The division of all costs into fixed and variable is conditional and is used in the classical model for calculating the break-even point. The specificity of a number of economic entities implies a more precise allocation of costs into separate types according to economic meaning.
In particular, production costs can additionally be:
- Conditionally permanent. For example, the rent of a warehouse is a fixed component, while the cost of storing and moving inventory is a variable component;
- Conditional variables. For example, the payment for depreciation (wear and tear) of capital equipment is a constant value, while the cost of scheduled and current repairs is a variable value.
Cost accounting systems at different enterprises are different (for example, standard costing, direct costing, variable costing, etc.). There is a division of variable costs into individual ones for each product, a distinction between fixed costs and individual costs for each product, etc.
This article will discuss in detail the classic model for calculating the break-even point for a single product, as well as an example of a calculation with several types of goods.
Formula for calculating the indicator

The break-even point (abbr. BEP) is calculated mathematically both in monetary and physical terms. It all depends on the characteristics of a particular company. When calculating according to the classical model with the participation of one product (or several - then averaged data are taken), assumptions are taken into account for a number of factors:
- Fixed costs within a given volume of production remain unchanged (this level is called relevant). This also applies to variable costs and prices;
- Output and the cost of finished products increase or decrease linearly (in direct proportion);
- The production capacity over a given calculation interval is constant;
- The product range does not change;
- The effect of inventory size is immaterial. That is, the value of work in progress has minor fluctuations and all manufactured products are released to the buyer.
This economic indicator should not be confused with the payback period (point) of the project. It shows the time (months, years) after which the company will begin to make a profit from the investment.
Break-even point in monetary terms
The calculation formula will show the minimum amount of revenue that will pay off all costs. The profit will be zero.
Calculated as follows:
![]()
In the denominator, the difference between revenue and variable costs is the contribution margin (MA). It can also be calculated for 1 unit of production, knowing that revenue is equal to the product of price and volume:
B=P*Q
MD for 1 unit. = P - Zper. for 1 unit
To determine the break-even point using a different formula, find the marginal income ratio (Kmd):
![]()
![]()
The final value in both formulas will be the same.
Break-even point in physical terms
The calculation formula will show the minimum sales volume to cover all production costs with zero profit. Calculated as follows:
![]()
Each next sold unit of goods in excess of this critical volume will bring profit to the enterprise.
With a known value of VERNat. you can calculate VERDEN.:
VERDEN. = VERN. *P
How to Calculate Break Even Point in Excel
In Microsoft Office Excel, it is very convenient to calculate the break-even point. Between all the data it is easy to establish the required formulas and build a table.
Table order
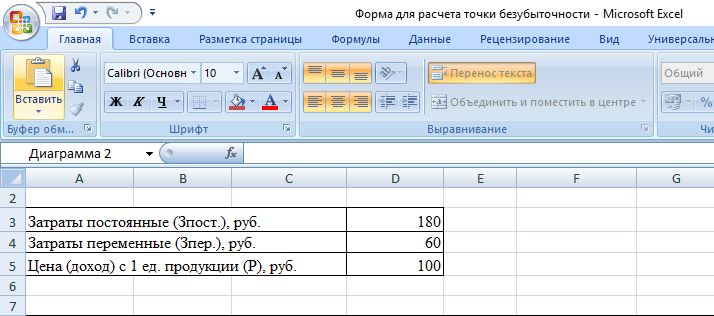
First you need to enter the cost and price indicators. Suppose that fixed costs are 180 rubles, variable costs are 60 rubles, the price for 1 unit of goods is 100 rubles.
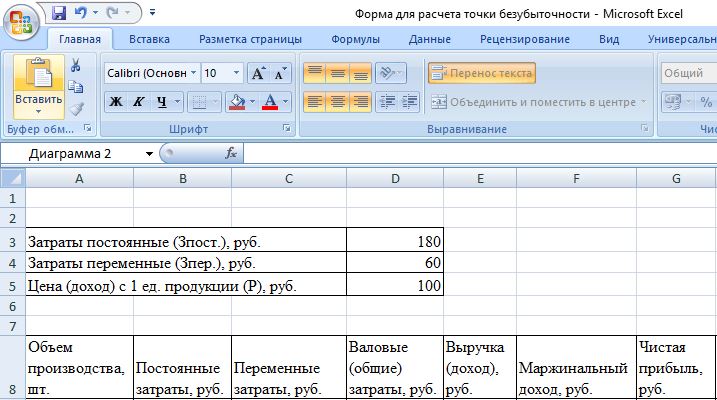
The value in the columns will be as follows:
- We fill in the volume of production ourselves, in our case we take the interval from 0 to 20 pieces;
- Fixed Costs =$D$3;
- Variable costs =A9*$D$4;
- Gross (total) costs = B9 + C9;
- Revenue (income) \u003d A9 * $ D $ 5;
- Marginal income \u003d E9-C9;
- Net profit (loss) = E9-C9-B9.
These formulas in the cells must be carried out throughout the column. After filling in the values by production volume, the table will take the following form:
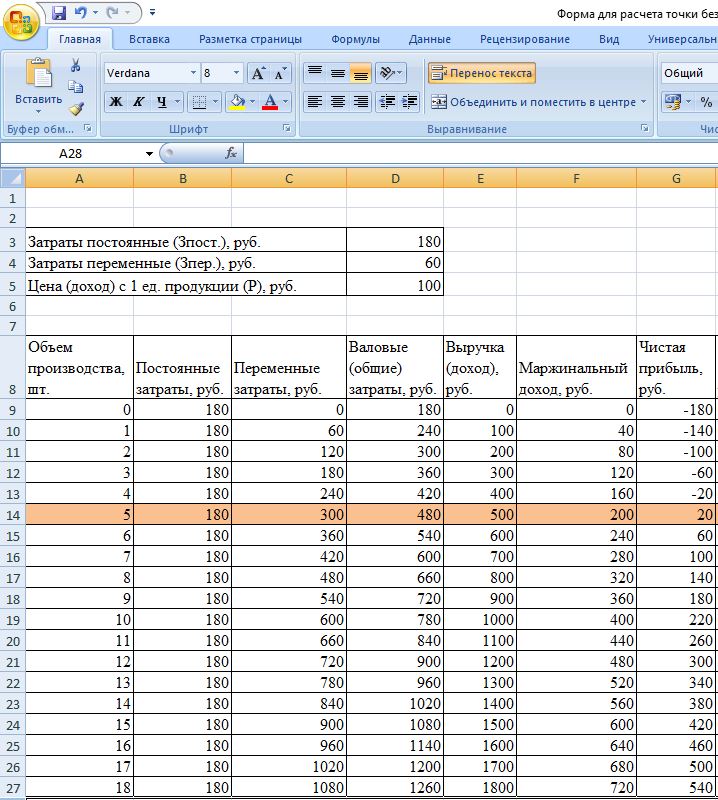
Starting from the 5th unit of production, the net profit became positive. Prior to this, revenue did not cover the total (total) costs of production. In this case, the profit is equal to 20 rubles, that is, formally, this is not a completely correct break-even point. The exact value of the volume at zero profit can be calculated:
![]()
That is, the break-even point is mathematically calculated at a production volume of 4.5 units. However, the economist takes into account 5 pcs. and the value of the proceeds is 480 rubles. is considered a break-even point, since to produce and sell 4.5 pcs. goods is not possible.
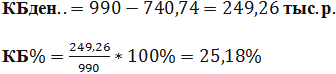
Let's add 2 more columns to the table with the calculation of the safety edge (safety margin, safety margin) in monetary terms and as a percentage (KBden and KB%). This indicator indicates the possible size of the decline in revenue or production to the breakeven point. That is, how far the enterprise is from the critical volume.
Calculated according to the formulas:
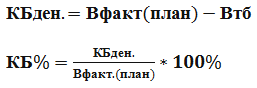
- Vfact. (plan) - actual or planned revenue;
- Wtb - revenue at the break-even point.
In this example, the value of actual revenue is taken. When planning the volume of sales and profit, they use the value of the planned revenue to calculate the required margin of safety. In the table, these columns will be calculated as follows:
- Safety edge in rub. = E9-$E$14;
- Safety edge in % = H10/E10*100 (the calculation is carried out starting from the production volume of 1 piece, since division by zero is prohibited).
A safe margin is considered to be a margin of safety above 30%. In our example, the production and sale of 8 pcs. goods and more means a stable financial position of the company.
The final table will look like:
![]()
Graphing algorithm
For clarity, we will build a graph. Select Insert/Scatter Plot. The data range includes gross (total) costs, revenue, net profit. The horizontal axis will be the volume of production in pieces. (it is selected from the values of the first column), and along the vertical - the sum of costs and revenues. The result is three slanted lines.
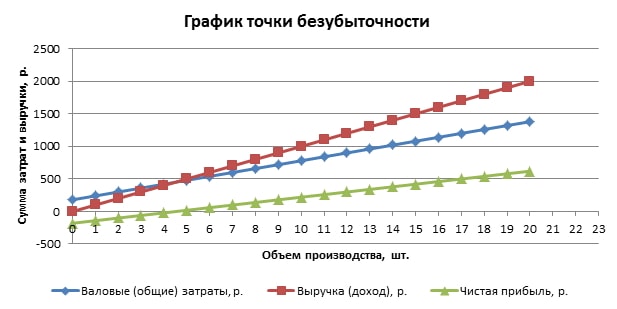
The intersection of revenue and gross costs is the break-even point. It corresponds to the value of net profit 0 (in our example, 20 rubles with a quantity of products of 5 pieces) horizontally and the minimum required revenue value to cover the total costs vertically.
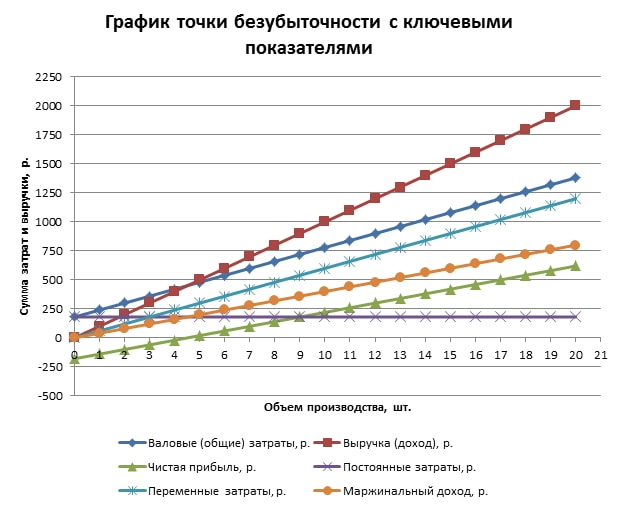
You can build a more detailed schedule, which includes, in addition to the above indicators, fixed, variable costs and marginal income. To do this, the specified rows are sequentially added to the data range.
How to use the finished table in Excel
To calculate the break-even point, you just need to substitute your initial data, and also enter the values of production volume in the first column. If there are a lot of them, then to speed up the work, you can write in cell A10, for example: \u003d A9 + 1 and draw this formula down. Thus, the interval between volume values will be 1 piece. (you can enter any number).
- Download a ready-made excel file for calculating the break-even point
Break-even point calculation example
For example, let's take an entrepreneur selling watermelons in summer stalls. He has one product, the price is the same in different parts of the city. Watermelons are purchased in bulk in the southern regions and delivered for sale in central Russia. The business is seasonal but stable. The initial data is as follows:
It is necessary to determine the minimum allowable volume of sales of watermelons and the threshold value of revenue to cover all costs.
The order of calculation by the mathematical method
The price of 1 watermelon is taken as an average, since they all have different weights. These fluctuations can be neglected. To calculate the break-even point in physical terms, we use the well-known formula:
To calculate the break-even point in monetary terms, you need to know the number of watermelons sold per month and the amount of variable costs for this volume:
- Q per month = 36000/250 = 144 watermelons,
- Zper. per volume per month = 130 * 144 = 18720 rubles.
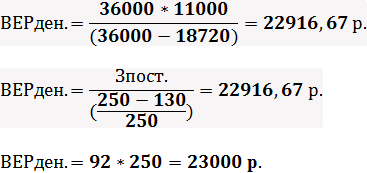
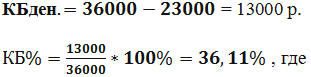
The first two values give a break-even point at zero profit, but the volume of watermelons sold will be 91.67 units, which is not entirely correct. The third value is calculated based on the critical sales volume of 92 watermelons per month.
The current monthly income and sales volume are above the break-even point, therefore the entrepreneur is working at a profit.
Additionally, we determine the value of the safety edge:
A level above 30% is considered acceptable, which means that the business is planned correctly.
The procedure for calculating the graphical method
The break-even point can also be calculated using a graphical method, without preliminary calculations. To do this, the volume of output in pieces is plotted along the horizontal abscissa axis, and the sums of revenue and total costs (slanted lines) and fixed costs (straight line) are plotted along the vertical ordinate axis. Then they draw manually or build a diagram on a computer according to the initial data.
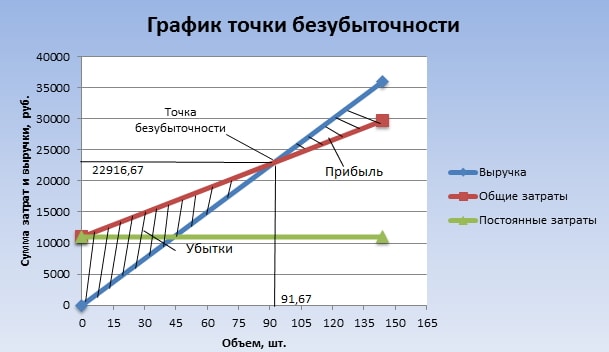
As a result of plotting the graph, the break-even point will be at the intersection of the lines of revenue and total costs. This corresponds to a sales volume of 91.67 watermelons and a revenue of 22916.67 rubles. The shaded areas show profit and loss zones.
The above calculation model for one product is characterized by simplicity of analysis and calculation of the break-even point. Well suited for companies with a stable market without sharp price fluctuations.
However, the above calculation has the following disadvantages:
- Seasonality and possible fluctuations in demand are not taken into account;
- The market may grow due to the emergence of progressive technologies, new marketing moves;
- Feedstock prices may change;
- For regular and "large" buyers, it is possible to provide discounts.
Thus, the break-even point calculation data is considered in conjunction with many factors and other economic indicators.
Break-even planning in the enterprise
Based on the obtained values of the break-even point, an analysis of the current market conditions is carried out and the most significant factors influencing . Planning for further work consists in forecasting production costs and a competitive market price. This data is used in the calculation of the production plan and break-even, which are included in the overall financial plan of the company. For the successful functioning of the enterprise, control over compliance with the approved goals is carried out.
Successive stages of break-even planning:
- Analysis of the current state of affairs in the company and sales . Strengths and weaknesses are identified and determined taking into account internal and external factors. The work of supply and marketing services, the level of management at the enterprise, the rationality of the production process are evaluated. From external factors, the market share controlled by the company, the activities of competitors, changes in consumer demand, the political and economic situation in the country, etc. are taken into account;
- Forecast of future prices for manufactured products, taking into account the assessment of all factors from paragraph 1 . Allowable margin range is planned. Alternative options for selling to new markets or restructuring the enterprise to produce similar products in the event of an unfavorable situation in the current market are being explored;
- Calculate fixed, variable costs and production costs . The volume of work in progress is planned at all stages of production. The need for fixed and working capital and the sources of their acquisition are being formed. Additional possible expenses on loans, and other obligations are also taken into account in production costs;
- Breakeven point calculation in progress . The required value of the safety edge is determined. The more unstable external factors, the greater the margin of safety should be. Next, the volumes of production and sales of goods at the level of the safety edge are calculated;
- Planning the company's pricing policy . Prices are determined for products that will achieve the required sales volume. Once again, the break-even point and safety edge are recalculated. If necessary, paragraphs 3 and 4 are repeated in order to find reserves for cost reduction in order to achieve the required safety margin values;
- Adoption of the final break-even plan and sales by period . The data is validated by the critical volume point.
- Break-even control , divided into several components: control of all items of expenditure, total cost, sales plan, receipt of payments from customers, etc. The company should always have an understanding of how the current financial situation corresponds to the planned break-even level.
Calculation example for a store

Using the example of a store that sells several types of goods, we will consider a variant of solving a multi-product problem. These are musical instruments and related products: electric guitar (A), bass guitar (B), sound amplifier (C), acoustic guitar (D). The store has fixed costs as well as individual variable costs for each type of product. They are purchased from different suppliers and bring their own amount of revenue.
The initial data is as follows:
| Product | Revenue from the sale of goods, thousand rubles | Individual variable costs, thousand rubles | Fixed costs, thousand rubles |
| A | 370 | 160 | 400 |
| B | 310 | 140 | |
| IN | 240 | 115 | |
| G | 70 | 40 | |
| Total | 990 | 455 | 400 |
The store is quite large, but the revenue structure by types of goods does not change significantly. The assortment and prices for them are different, therefore it is more rational to calculate the profitability threshold in monetary terms. To solve this problem, we use formulas and methods from direct costing, which assumes a range of break-even points for such a case:
![]()
Kz. per. - coefficient of the share of variable costs in revenue.
![]()
In the following table, we will calculate it for each type of product and general for the entire store. And also calculate the marginal income (Revenue - individual variable costs) and its share in revenue:
| Product | Marginal income, thousand rubles | Share of marginal income in revenue | Kz. per. (share of variable costs in revenue) |
| A | 210 | 0,37 | 0,43 |
| B | 170 | 0,55 | 0,45 |
| IN | 125 | 0,52 | 0,48 |
| G | 30 | 0,43 | 0,57 |
| Total | 535 | 0,54 | 0,46 |
After calculating Kz. per. for the entire store, the average break-even point will be equal to:
Now let's calculate this indicator according to the most optimistic forecast. It is called marginal ordering in descending order. The table shows that the most profitable products are A and B.
Initially, the store will sell them and the total marginal income (210 + 170 = 380 thousand rubles) will almost cover the fixed costs (400 thousand rubles). The remaining 20 thousand rubles. will be received from the sale of product B. The break-even point is equal to the sum of the proceeds from all listed sales:
The most pessimistic sales forecast is the marginal ascending order. At first, goods D, C and B will be sold. The marginal income from them (125 + 30 + 170 \u003d 325 thousand rubles) will not be able to cover the fixed costs of the store (400 thousand rubles). The remaining amount is 75 thousand rubles. will be received from the sales of product A. The break-even point will be equal to:
Thus, all three formulas gave different results. In essence, the optimistic and pessimistic forecasts give an interval of probable break-even points for the store.
Additionally, we calculate the margin of safety in monetary terms and as a percentage of the average break-even point:
Although the store is profitable, the margin of safety is below 30%. Ways to improve financial performance are to reduce variable costs and increase sales of goods D and C. Also, you need to check fixed costs in more detail. Perhaps there are reserves to reduce them.
Calculation example for an enterprise
For example, let's take a 1 liter household solvent production facility. The company is small, prices rarely change, so it is more rational to calculate the profitability threshold in physical terms (number of bottles).
The initial data is as follows:
The calculation will be as follows:
The resulting value is very close to the actual volume (3000 pieces).
Additionally, we calculate the safety edge in pieces (according to a formula similar in monetary terms) and as a percentage:
![]()
Thus, the enterprise operates on the verge of break-even. Urgent measures are needed to improve the financial situation: a review of the structure of fixed costs, perhaps the salary of management personnel is too high. It is worth understanding in detail the costs that form variable costs. The primary direction of their reduction is the search for new suppliers of raw materials.
 Ready-made business plan with calculations using the example of a web studio
 Registration of an internal memorandum: sample document and drafting rules
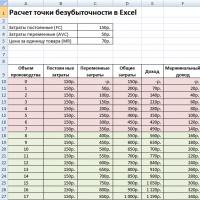 Break even. Formula. Example of model calculation in Excel. Advantages and disadvantages
 Advance report is ... Advance report: sample filling
 How to stitch documents with threads by hand?
 Disciplinary sanction for non-fulfillment of official duties
 Binding your book