Break-even point: mathematical and graphical method, calculation in monetary and natural terms + examples of calculation of single-commodity and multi-commodity production
Every entrepreneur thinks about earning methods and ways to make a profit. In any production there are costs - the costs of manufacturing and selling goods. They will be deducted from the received revenue, the result of the calculations will be profit (positive value) or loss (negative value).
For profitable operation, the management of the enterprise must know the boundary value of the transition of loss into profit. This is called the breakeven point. It is used by investors to determine the probability and payback period of projects.
The break-even point can be determined using mathematical calculations or graphically. The value will be in monetary or natural terms.
What's happened
The break-even point or critical volume is the amount of production at which the income received from sales will cover the total costs. In other words, this is the size of the minimum profit in monetary terms or the quantity of products sold, which compensates for costs.
Work at this point indicates the absence of profit and costs at the same time. With an increase in volume by at least 1 unit, the enterprise will begin to work in profit. The break-even point is often referred to as the profitability threshold.
Purpose
The break-even point value is used to analyze the current financial condition and allows you to plan for the future. The indicator allows you to:
- evaluate financial stability and solvency, which is used by investors, management and creditors;
- calculate the feasibility of expanding and mastering new types of products, technologies;
- see the dynamics of the indicator, identify bottlenecks in production;
- sales plan planning;
- establish an acceptable reduction in revenue, which will allow you to remain in profit;
- trace the impact of production costs, the cost of goods and the volume sold on the financial result.
Calculation
The calculation can be made in various ways, depending on the type of costs. Consider the classical order that underlies the rest of the methods.
Data for calculation
To correctly determine the value of the break-even point, you should distinguish between fixed and variable costs and know:
- unit cost of goods R;
- produced and sold volume - Q;
- proceeds received - IN(not required to determine the threshold of profitability);
- the amount of fixed costs - Zpost.
- variable costs - Zper.
Fixed costs are costs incurred that do not depend on the volume produced, that is, they remain unchanged for a long time. These include:
- wages with insurance premiums for managerial and engineering staff;
- rental of premises;
- tax payments;
- depreciation;
- leasing obligations.
Variable costs are costs that depend on the quantity of output produced. They have different meanings and respond quickly to changes in production. Variable costs are:
- the price of raw materials, spare parts and components;
- piecework wages and insurance payments for production workers;
- HMS, electricity, fuel;
- transportation.
The division of costs is conditional and is used to determine the break-even point. The specificity of some enterprises implies a more detailed division according to economic meaning. For example, production costs are:
- conditionally permanent: storage and warehouse movement of components;
- conditional variables: the cost of current and scheduled repairs.
There are several cost accounting systems: variable costing, direct costing, standard costing, etc. Each type of cost can be individual for a certain type of product.
Formula
The mathematical method (VER) allows you to determine the break-even points in natural and monetary terms. The classical scheme involves the calculation for one product. If it is necessary to determine the indicator for several types of products, then averaged data are used in the calculation. The following assumptions apply:
- Each type of cost and the cost of the goods remain constant for the selected volume.
- Directly proportional change in output and cost.
- Production capacities in the period selected for calculation are constant.
- Unchanged product range.
- Insignificant influence of stocks - the share of work in progress is small, and all products are sold for sale.
BEP is often confused with the payback period of a project. This is the time after which the organization will receive a return on investment.
Definition in monetary terms
Using the calculation, you can find out the minimum value of revenue, which will help cover the costs of production and sales. Profit will be 0.
VERDEN \u003d V * Zpost / MD
MD = V-Zper
B \u003d P * Q
IN- revenue;
P- the cost of production;
Q- produced volume;
MD- marginal income, which can be calculated per unit of production, taking into account the fact that revenue will be equal to the product of price and volume.

MD for 1 unit. \u003d P - Zper. for 1 unit
The break-even point in monetary terms is found through the marginal income ratio - Kmd:
Kdm \u003d MD / V \u003d MD for 1 unit / R
VERDEN = Zpost/Kmd
The final value when calculating according to the two formulas must match.
Definition in kind
The above formula allows you to determine the minimum volume of sold products that can cover production costs and lead to zero profit.
VERNAT \u003d Zpost / (P-Zper by 1 unit)
Each subsequent unit that allows you to exceed a certain volume will bring profit to the organization. If the break-even point is known in physical terms, then it is easy to calculate the break-even point in monetary terms:
VERDEN \u003d VERNat * P
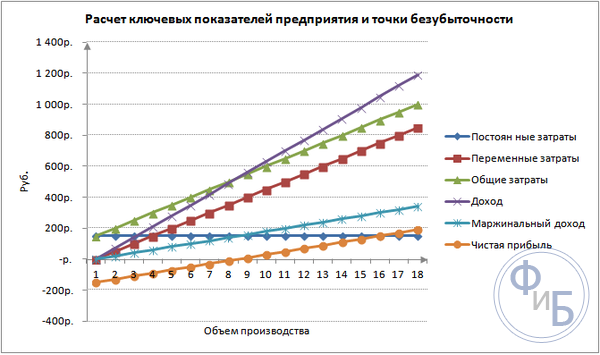
Graphic method
The graphical method allows you to determine the break-even point without mathematical calculations. Build a graph that indicates revenue, fixed and variable costs. The horizontal axis will be the volume, and the vertical axis will be the amount of costs and revenues in rubles.
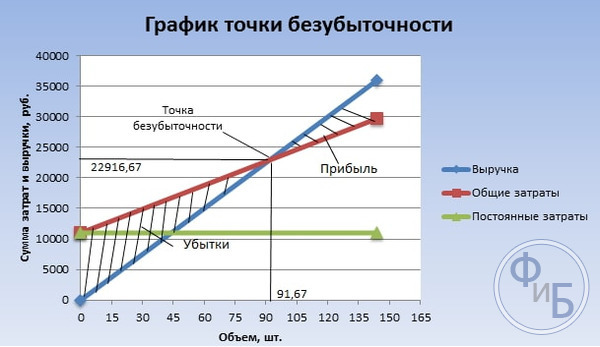
The break-even point will be at the intersection of total costs and revenue. On the graph, this value is equal to 91.67 pieces with a revenue of 22,916.67 rubles.
Calculation in Excel
For the convenience of the calculation, you can use the Excel office application. It is easy to establish a connection between data and build tables with graphs for comparison.
Compiling a table
It is necessary to start calculating the break-even point by entering data on costs and the cost of goods. For example, fixed costs are 150 rubles, variable costs are 50 rubles, and the cost of a unit of goods is 70 rubles.
Based on the entered data and production volume, a table is formed, where the dynamics of changes in net profit or loss should be traced. This is necessary to determine the break-even point.
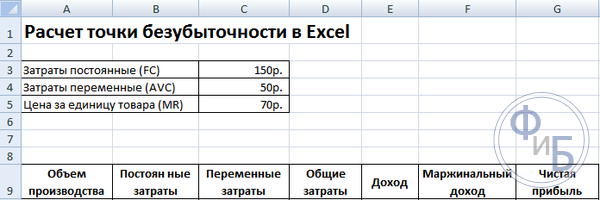
Let's create a second table with columns:
- Volume of production.
- Fixed costs.
- variable costs.
- General costs.
- Revenue.
- Marginal income.
- Net profit.
The volume of production is chosen independently. In the example, 0-20 pieces are taken. Fixed costs are transferred from the first table of cell D3. Since fixed costs do not depend on the volume of products produced, their value remains unchanged throughout the column. To preserve the value of a cell when propagating values, the address is preceded by a $ sign - $D$3.
Variable costs are determined by the formula:
Zper = Q*Zper per 1 unit. = A9*$D$4
Total costs, they are also called gross, are equal to the sum of variable and fixed costs - B9 + C9.
Revenue or income is equal to the product of volume and the cost of a unit of goods - A9*$D$5, and marginal income - E9-C9.
Net profit, as mentioned above, is equal to marginal income minus fixed costs: E9-C9-B9.
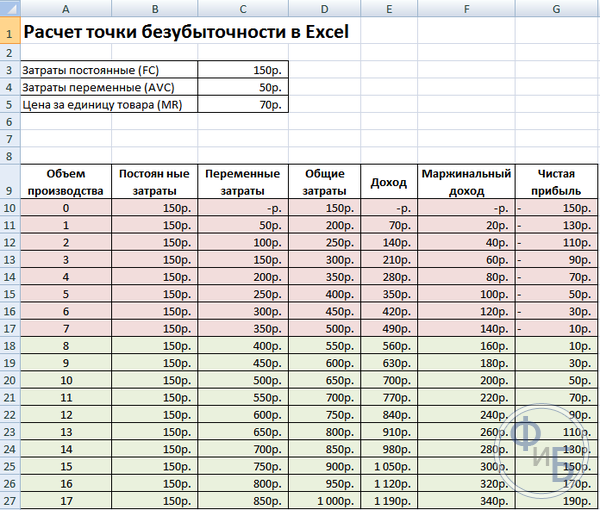
From the eighth unit, the organization will begin to make a profit. With a smaller volume, revenue cannot cover the total costs. The first profit is 10 rubles, that is, this is not quite a break-even point, when total costs are equal to revenue. The exact value can be determined by the formula:
TBnat \u003d 150 / (70-50) \u003d 7.5 pcs.
The mathematical value of the break-even point is 7.5, but it is not possible to produce some part of the whole product. Economists round up the value - 8 pcs. The proceeds will be 560 rubles.
Two additional indicators can be added to the table - the margin of safety (margin of safety) in monetary and percentage terms (KB%, KBden). This will help determine how much revenue is missing before the breakeven point is reached and by how much total costs need to be reduced to reach the breakeven point at a given volume. By these coefficients, you can determine a safe financial position - when it reaches 30%.
KBden = Vfact - Wtb = E9-$E$14
KB% \u003d KBden * 100% / Vfact \u003d H10 / E10 * 100
Wtb- revenue for the security point;
In fact- actual income.
Plotting
For understanding, build a graph. There are several types of charts in Excel. The best perception of information in this example will be a scatter plot, which is located in the "Insert" tab. The horizontal axis shows the volume of products produced, and the vertical axis - revenue and the amount of costs. Data to build:
- total costs;
- net profit;
- revenue.
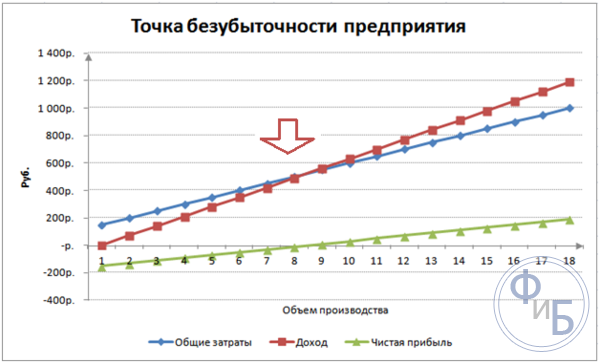
There are three straight lines on the graph. The intersection of total costs and revenue will be at the break-even point. It shows net profit of zero horizontally and the minimum revenue to cover the costs incurred vertically.
To build a detailed graph with marginal income and variable costs, you need to expand the amount of data.
Calculation example
The simplest are the calculations for mono production, when the organization produces the same type of product. Multi-product tasks have their own characteristics, which should be taken into account when calculating the break-even point.
One item
Consider a common example of entrepreneurial earnings - trading in the market. The commodity is watermelons with a fixed value throughout the city. Watermelons are bought in the southern regions and brought to the central part of the country. The business is seasonal, but quite profitable.
Basic indicators:
- the cost of 1 watermelon is 250 rubles;
- Zper for 1 unit. (seller's salary, wholesale purchase) - 130 rubles;
- Zpost (taxes, rent of a place in the market, transportation, packaging) - 11,000 rubles. per month;
- monthly revenue - 36,000 rubles.
For successful planning, it is required to calculate the minimum sales volume and the profit value to cover the costs incurred.
The indicated cost is an average, since the weight of each watermelon is different. These values can be neglected in the calculation.
Determination of the break-even point:
VERN = 11000 / (250-130) = 92 pcs.
To determine in monetary terms, calculate the volume of watermelons sold and the value of variable costs for this volume:
Q month = 36000/250 = 144 pcs;
Zper per volume \u003d 130 * 144 \u003d 18720 rubles.
Let's determine the profitability threshold in money according to various formulas:
VERDEN \u003d 3600 * 11000 / (36000-18720) \u003d 22916.67 rubles
VER den \u003d Zpost / ((250-130) / 250) \u003d 22916.67 rubles
VERDEN \u003d 92 * 250 \u003d 23,000 rubles
The first and second values show the break-even point when the profit is 0. At the same time, the sales volume is 91.67 watermelons, which is incorrect information. The third indicator is based on the critical volume of 92 watermelons.
The comparison shows that the monthly revenue exceeds the break-even point, which allows us to talk about profit.
Safety Edge:
KBden \u003d 36000-23000 \u003d 13000 rubles;
KB% = 13000/36000 * 100% = 36.11%
The level is more than 30%, which indicates the correctness of business planning.
Multi-product task
Consider the calculation procedure for a store that sells four goods: A, B, C and D. The store incurs fixed costs and has variable costs for each type separately. The purchase is made from different suppliers, the proceeds from the sale are also different.
Initial data:
- A: revenue 370 thousand rubles, variable costs 160 thousand rubles;
- B: revenue 310 thousand rubles, variable costs 140 thousand rubles;
- B: revenue 340 thousand rubles, variable costs 115 thousand rubles;
- G: revenue 70 thousand rubles, variable costs 40 thousand rubles.
The amount of total revenue is 990 thousand rubles, and variable costs are 455 thousand rubles.
The revenue structure remains constant. Due to the fact that the range and cost of goods is different, it is better to calculate the break-even point in monetary terms. The solution will be based on the direct costing method, which assumes a range of values:
VERDEN \u003d Zpost / (1-Kz.per.);
Short lane. - share of variable costs in revenue:
Kz.per. = Zper/V
- A - 0.43;
- B - 0.45;
- B - 0.48;
- G - 0.57;
- General short circuit - 0.46.
Let's define marginal income and its share in revenue:
- A - 210 thousand rubles, 0.37;
- B - 170 thousand rubles, 0.55;
- B - 125 thousand rubles, 0.52;
- G - 30 thousand rubles, 0.43;
- The total value is 535 thousand rubles, 0.54.
Let's calculate the average break-even point:
VERDEN Wed = 400 / (1-0.46) = 740.74 thousand rubles.
Next, consider the most optimistic forecast - marginal ordering in descending order. The first two products A and B will have the highest profitability. Initially, the store should sell these products, which will provide a marginal income of 210 + 170 = 380 thousand rubles. This will almost cover fixed costs of 400 thousand rubles. The rest can be taken from the third item. The break-even point will be reached after the sale of the following goods:
VERDEN. opt. \u003d 370 + 310 + (20 * 240/125) \u003d 718.4 thousand rubles.
A pessimistic forecast or marginal order in ascending order will be the sale of G, C, B. The total marginal income is 325 thousand rubles, which will not allow covering fixed costs. The remaining 75 thousand rubles must be received from the sale of product A. The value of the break-even point:
VERDEN. pessimistic \u003d 70 + 240 + 310 + (75 * 370 / 210) \u003d 752.14 thousand rubles.
As you can see, the value of the break-even point in the three cases is different. Optimistic and pessimistic values give an interval of possible break-even points.
Let's define the edge of safety in percent and rubles:
KBden \u003d 990-740.74 \u003d 249.26 thousand rubles;
KB% = 249.26/990*100% = 25.18%.
Despite the presence of profit, the safety margin of the store is less than 30%. It is necessary to take measures to improve the financial performance. To do this, it will be necessary to reduce Zper and increase the volumes for goods A, C and D. It will not be superfluous to check fixed costs in detail in order to find reserves for their reduction.
Calculation for the enterprise
Consider an organization that produces household solvent, which is sold in liter containers. The company is small, the cost rarely changes, which allows you to calculate the break-even point in physical terms.
Data for calculation:
- the cost of one bottle is 140 rubles;
- variable costs for 1 liter - 80 rubles;
- fixed costs - 170 thousand rubles;
- revenue - 450 thousand rubles;
- volume - 3 thousand rubles.
VERNAT. \u003d 170,000 / (140-80) \u003d 2833.33 pcs.
The calculated value is close to the actual volume - 3000 pcs.
Let's define the edge of safety:
KBnat. = 3000 - 2834 = 166 pcs.
KB% = 166/3000 * 100% = 5.53%
It can be concluded that the company is on the verge of break-even. Urgent measures should be taken to improve the situation: the cost structure should be reviewed, the remuneration of management personnel is likely to be overstated. Work out variable costs in detail and find cheaper suppliers.
Advantages and disadvantages of calculations
The main advantage of calculating the break-even point allows you to quickly and easily analyze the level of production or sales that is necessary to achieve a minimum critical level. The disadvantage of the above model is the construction restrictions:
- Linear change in sales and production. This does not allow us to take into account the sharp surges and changes that occur in reality. Linearity does not take into account seasonality, a decrease or increase in demand, or the entry of new competitors into the market. All this affects future demand, and, accordingly, sales volumes. New technologies can be introduced into production, which increases production volumes.
- The model has high efficiency in a low-competitive market with stable consumer demand for manufactured products. Globalization is becoming the culprit of market stability.
- Sales volume depends on many factors: marketing, dealer network size, product quality, seasonality, etc.
- Such calculations do not show an adequate picture for small enterprises in which the nature of sales is unstable.
Break even planning
The listed methods are easy to calculate for one product and are suitable for companies with a stable market and a constant selling price.
However, there are a number of disadvantages:
- it is impossible to take into account seasonality and cost fluctuations;
- markets often become more specific, progressive technologies and marketing moves appear;
- the cost of raw materials may vary;
- discounts are provided to regular customers and wholesalers, which is not taken into account in the formula.
The analysis of the break-even point should take place in conjunction with various factors and economic indicators.
According to the data obtained, the current market conjecture and significant factors affecting the cost are analyzed. Planning consists in forecasting costs and competitive costs. The data is necessary for the break-even plan and the size of production, which are entered into the financial plan of the organization. For effective functioning, it is necessary to periodically monitor the implementation of the approved goals.
Planning stages:
- Analysis of the current situation. It is necessary to determine the strengths and weaknesses, as well as ways to reduce costs, taking into account external and internal factors. An assessment is given to sales and marketing services, the level of rationality of the production process and management. Among the external factors, they necessarily consider the occupied market share, the work of competitors, controlled companies, the economic and political situation, and changes in consumer demand.
- Forecasting the value in the future, taking into account the factors discussed earlier. There is a study of alternative sales options, a competitive margin range is planned, the possibility of restructuring to the production of similar products in the event of an unfavorable situation is being considered.
- Calculation of cost, fixed and variable costs. The size of work in progress, the need for working capital and fixed assets, sources for the acquisition of working capital are determined. The costs should take into account the possible costs of leasing, credit and similar obligations.
- Calculation of the break-even point. The required size of the safety edge is calculated: the less stable the external environment, the larger the safety edge should be. Then the output volume is determined taking into account the safety edge.
- Cost planning. The price of a product that will help achieve the desired level of sales is calculated. With the new cost, the break-even point, the margin of safety, is re-determined. If necessary, then steps 3 and 4 are repeated to search for reserves to reduce the cost and achieve the required margin of safety.
- Approval of the final sales plan and break-even by periods. Approval is made according to the value of the critical volume.
- Breakeven control. It takes place in several stages: control of expense items, sales plan, cost, transfer of payment from buyers. The management of the organization should always know the level of compliance of the current position with the planned break-even value.
The break-even point calculation helps determine the minimum production or sales frontier for organizations. The model is well used in large-scale production with a stable sales market. The break-even point model allows you to find a safe zone - the company's distance from the critical value, when profit becomes zero.
 Ready-made business plan with calculations using the example of a web studio
 Registration of an internal memorandum: sample document and drafting rules
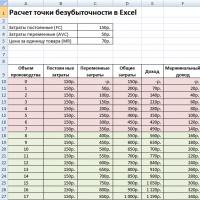 Break even. Formula. Example of model calculation in Excel. Advantages and disadvantages
 Advance report is ... Advance report: sample filling
 How to stitch documents with threads by hand?
 Disciplinary sanction for non-fulfillment of official duties
 Binding your book