Analysis of the effectiveness of the use of objects of labor. Analysis of the efficiency of using objects of labor (material resources). Analysis of the efficiency of using fixed assets
1. Specific consumption indicators raw materials, materials, fuel, etc. They are calculated on the basis of the existing scientifically based norms of stocks and consumption of raw materials and materials for the manufacture of products. For example, metal utilization is defined as the ratio of the net weight of the product to the weight of the workpiece.
2. Material consumption of products- it shows the total consumption of materials per unit of production:
where m is the specific consumption of material per unit of production;
M is the total material consumption for all products of this type;
Q is the physical volume of products of this type (in in kind).
3. When studying the specific consumption of objects of labor, calculate indices of compliance with the norms of consumption of materials and indices of the dynamics of specific consumption. In this case, four options for posing the question should be distinguished:
1) one type of materials is spent on the manufacture of one type of product;
2) one type of materials is spent on the manufacture of one type of product;
3) several types of materials are spent on the manufacture of one type of product;
4) several types of objects of labor are spent on the manufacture of several types of products.
In each of these cases, a different methodology for constructing indexes is used.
First option. Deviation of the consumption of one type of materials when producing one type of product for a separate the enterprise from the established standard or from the consumption in the base period is determined using individual indices:
 ,
,
where m 1 and m 0 - specific material consumption in the reporting and base year.
When studying the dynamics of the specific consumption of one type of materials for the release of one type of product for several enterprises can be built indices of variable, fixed composition and structural breaks.
A) Specific consumption index of variable composition

This index shows the change in the indicator on average for all studied enterprises. The value of the index in these calculations is formed under the influence of a change in the specific consumption at individual objects and a structural factor - a change specific gravity release of products with different specific consumption.
B) Fixed composition specific consumption index will reflect the average change in the specific consumption of the studied material for all enterprises
 .
.
V) Structural change index will reflect the influence of the structural factor on the change in the average level of specific consumption for the set of studied enterprises
 .
.
Second option. The index of the specific consumption of the material under study in the production of various types of products has an aggregate form:
 .
.
The difference between the numerator and denominator of the index will show the change in material consumption due to a change in its specific consumption.
The third option. When a variety of materials are required in the production of one type of product, the dynamics of unit costs can be determined using a cost estimate:
 ,
,
where p 0 is the price of the material (raw material) in the reference period.
The difference between the numerator and denominator will reflect the change in the cost of producing a unit of output as a result of a change in the specific consumption of materials used.
The fourth option. A characteristic of the change in the unit costs of various materials for the production of various products is general index of unit costs:
 ,
,
where is the actual cost of material costs for the entire production of the reporting period (rubles);
The cost of material costs for the entire output of the reporting year according to the value of the unit costs of the base year material (rubles).
The difference between the numerator and denominator of the index shows changes in the cost of material costs as a result of changes in unit costs.
TOPIC 13. STATISTICS OF PRODUCT COST.
The concept and objectives of the statistical study of the cost of production. Analysis of the structure of production costs.
2. Analysis of the dynamics of the cost and the degree of implementation of the plan to reduce it.
Indicator of costs per ruble of marketable products and analysis of its dynamics.
Question 1.
Under cost understand the amount expressed in monetary terms of costs associated with the release of a certain volume and composition of products. The cost price is a summarizing qualitative indicator of the enterprise's work. Its level serves as the basis for determining prices for certain types of products.
The tasks of cost statistics are to determine the total volume, level, structure, dynamics of the cost, the degree of fulfillment of the plan to reduce the cost of production and to study individual factors and certain types costs by elements and expense items that affect its value.
TO main cost indicators relate:
Indicators of the level of prime cost (planned, normative, reporting),
Indicators of the amount of costs attributable to one ruble of marketable products,
Cost structure indicators, i.e. composition of costs economic elements and according to calculation items),
Indicators of the dynamics of production costs (individual and general indices),
The amount of savings (cost overruns) as a result of a decrease (increase) in the cost price level.
Factors of reducing the cost of production are an increase in labor productivity, savings in material costs, an increase in the level of mechanization and automation of labor, a decrease in the cost of selling products, a decrease in administrative and management costs, etc.
Reporting and cost accounting data for industrial enterprises allow you to study the cost structure in two directions:
1) by economic elements of costs, when the entire amount of costs is divided into homogeneous constituent elements - material costs, wage, social insurance contributions, depreciation, others.
2) according to the articles of the calculation. Typical classification of industry costs by items of calculation provides for the allocation of the following items: raw materials and materials; recyclable waste; purchased products, semi-finished products and services of cooperative enterprises; fuel and energy for technological purposes; basic wages of production workers; deductions for social needs; expenses for preparation and development of production; equipment maintenance and operation costs; shop expenses; general plant costs; losses from marriage; others production costs; non-production costs.
When analyzing the cost structure, savings (cost overruns) are identified for individual cost items, and then the impact of these savings on the total percentage of deviations is established. actual cost from the planned or from the level of the prime cost of the previous period.
The study of the structure of the cost and its dynamics makes it possible to determine the influence of individual factors on the change in the level of the indicator.
Costs under the item "Raw materials and materials" depend on the specific consumption of materials and prices for these materials. That's why
I COST OF MATERIALS = I SPECIFIC EXPENDITURE * I PRICES FOR MATERIALS.
Costs under the item "Wages" depend on the labor intensity of products and average wages, i.e.
I SALARY COSTS = I EMPLOYMENT * I AVERAGE WAGE = I AVERAGE WAGE: I LABOR PRODUCTIVITY.
Based on this dependence, it is possible to determine the influence of the considered factors on the cost level.
Question 2.
Statistics studies the dynamics of the cost price and the degree of fulfillment of the plan for its reduction using individual and general indices.
Individual cost indices(used in relation to a unit of production of a particular type):
1) shows the dynamics of the cost according to the plan
2) shows the actual dynamics of the cost
2) shows the ratio of the actual and planned cost
The amount of savings from cost reduction can be set as the difference between the reported and baseline costs.
The total amount of savings received by the enterprise from reducing the cost is expressed by the product of savings per unit of product and the number of products produced in the reporting period (z 1 -z 0) * q 1.
Planned savings from cost reduction is expressed as (z pl - z 0) * q pl.
The difference between (z 1 -z 0) * q 1 and (z pl - z 0) * q pl will be the sum of the excess savings.
When studying the change in the level of the cost of one type of product manufactured by several enterprises, an index of the average cost of a variable composition can be constructed:
 ,
,
where z 1, z 0 - the cost of a unit of production in the reporting and base period;
q 1, q 0 - production output in kind in the reporting and base period;
Z 1, z 0 - the average cost of a unit of production in the reporting and base period.
The value of this indicator is influenced both by the change in the level of the cost of the products under study at individual enterprises, and by structural shifts in the output of products with different levels of cost.
The index of the average cost of a fixed composition is not affected by structural changes and shows the average change in the cost of production:

This index can also be used to study the dynamics of dissimilar products. The difference between the numerator and denominator of the index will reflect the change in the amount of production costs due to a change in the cost of production.
The influence of the structural factor on the level of production costs can be determined using the index of structural breaks:
 .
.
The same result can be obtained if the variable composition index is divided by the constant composition index.
The construction of the considered prime cost indices is valid only for comparable products, i.e. the one that was produced in the compared periods.
When studying the cost, one should exclude the influence of factors that do not depend on the operation of enterprises. These factors are changes in prices for raw materials and materials and tariffs for their transportation, as well as for electricity. If the change in production costs in the reporting period due to the above factors is designated as, then the index of the cost price dynamics will take the form:

where "+ a" - will be valid in the calculations for reducing costs,
and "-a" - with their increase.
General indices of production costs(applicable for the release of several types of dissimilar products by one enterprise) .
When several types of products are produced by one enterprise, an index should be calculated that characterizes the dynamics of the cost of all these types of products. The formula for such an index in aggregate form is as follows:
 ,
,
where S z 1 q 1 - the sum of the actual costs for the products of the reporting period;
S z 0 q 1 - the notional amount of costs for the same products of the reporting period at the basic levels of the unit cost of each product.
Since it is possible to reduce the cost of those products that already had some kind of cost before, the construction of all the previously cited indices, including this one, will be valid only for comparable products, i.e. for such products that were produced at this enterprise not only in the reporting period, but also in the baseline.
Products that undergo structural changes (weight reduction, design simplification) do not lose comparability if they do not lose their consumer properties. It is impossible to refer to comparable products as products that in the base period were manufactured in an experimental order, and in the reporting period - in a serial or mass order (since the production of prototypes is very high costs and you can get the wrong idea about reducing the cost). At the same time, products made in both periods in individually, are comparable if they have the same consumer properties.
The fulfillment of the plan when studying the cost of comparable commercial products is checked by comparing the actually achieved percentage of cost reduction with the percentage established by the plan. At the same time, it is also necessary to establish how much the actual cost of all manufactured products is lower or higher than the planned cost, i.e. establish the deviation of the actual cost from the planned one. It is also important to determine the absolute amount of savings from cost reduction.
To do this, calculate following indicators:
1. Planned cost index (shows the planned percentage of cost reduction):

For example,
 or 96.89%,
therefore, according to the plan, it was envisaged to reduce the cost of production comparable to the previous year by 3.1%.
2. Planned savings from reducing the cost of comparable products in absolute terms: as the difference between the numerator and denominator of the planned cost index.
With regard to our situation: In absolute terms, this amounts to 34 rubles of savings, since products for which at the cost of the previous year require expenses in the amount of 1,096 rubles, according to the plan, should be released with costs in the amount of 1,062 rubles.
3. Actual cost price index (shows the actual percentage of cost reduction):
4. The actual amount of savings from reducing the cost of comparable products: as the difference between the numerator and denominator of the reported cost index.
5. An idea of the ratio of the actual and planned cost can be obtained by calculating the corresponding index (it shows how many percent the actual cost is higher (below) the planned one):

6. Saving or overspending of the actual cost versus the planned one: as the difference between the numerator and denominator of the fifth indicator.
The dynamics of the cost of production of several enterprises is characterized by an index calculated by following formula:
 . (for two enterprises)
The numerator of the fraction represents the sum of the numerators of the indices of all enterprises, and the denominator is the sum of their denominators. The index calculated in this way is called the factory cost index. This index is calculated based on the cost of comparable products only.
The dynamics of the cost of production of opposite names of several enterprises is calculated by applying the formula for the cost index according to the industry method:
 .
.
In this case, for each type of product, it is not the cost level at each enterprise in the past year that is taken as the base, but the average industry level of the unit cost. To do this, for each type of product, it is necessary to establish the average sectoral cost per unit of production in the last year.
(). With the sectoral method, the range of comparable products expands, since in this case all products whose production took place last year, not only at this enterprise, but also at any other enterprise of the same industry, will be included in it.
Revealing the influence of assortment shifts on the amount of savings (cost overruns) from reducing production costs.
The index of the cost of production, on the basis of which the percentage of cost reduction actually achieved by the enterprise is determined, has the form:
The planned prime cost index is calculated by the formula:
.
It can be seen from the formulas that the actual percentage and the amount of savings from cost reduction may differ from the planned ones, since the levels of cost price are different and the actual output differs in its composition from the planned one.
Therefore, when studying the actual dynamics of the cost in comparison with the planned one, one should proceed not only from the percentage of reduction, but also from the amounts of savings or cost overruns compared to the previous year, while distinguishing:
1) savings from reducing the cost of a unit of production (planned and over-planned);
2) excess savings obtained as a result of overfulfillment of the production plan;
3) a decrease in the amount of planned savings due to non-fulfillment of the production plan.
Calculations should be made for each type of product as follows. The planned savings from reducing the cost of units of each type of product is taken as the difference between the planned cost of a unit of production and its average annual cost in the previous year, multiplied by the planned number of units of production. Above-planned savings (cost overruns) is set as the difference between the actual and planned unit cost, multiplied by the number of units produced. The amount of excess savings obtained as a result of overfulfillment of the production plan, as well as a decrease in the amount of planned savings due to failure to fulfill the production plan, are established by multiplying the difference between the planned unit cost and its actual cost in the previous year by the difference between the actual and planned output. In this case, the above-planned savings will be with a "-" sign, and a decrease in savings (as an overrun) - with a "+" sign.
Question 3.
V general view the indicator of the level of costs per 1 ruble of commercial products has the form
where z is the unit cost;
q - the number of units of products of each type;
p is the unit price.
those. it is necessary to divide the cost of marketable products by the cost of the same marketable products.
The main advantage of the indicator of costs per ruble of marketable products is that it allows you to cover all products, both comparable to the previous period, and not comparable.
In a statistical study of the cost per ruble of marketable products, the following is calculated the following types this indicator:
1) Planned indicator costs per ruble of marketable products can be written as follows:
 .
.
2) Actual indicator costs per ruble of marketable products:
 .
.
In addition, two more indicators of the cost per ruble of marketable products are calculated:
1) the cost per ruble of actually released marketable products based on the planned cost and prices adopted in the plan:
 .
.
3) the actual costs per ruble of manufactured commodity products in prices adopted in the plan:
 .
.
The dynamics of the costs of commercial products can be traced using index of actual costs to planned:
 .
.
This ratio can be decomposed into three components, and the absolute value into three terms:
1)  ... This ratio characterizes the impact of price changes on the cost per ruble of marketable output in relation to the actual output. In absolute terms, the change in costs per ruble of marketable output as a result of price changes will be determined as the difference between the numerator and denominator of this index.
2)  ... This ratio characterizes the effect of a change in the cost of actually manufactured products on a change in the value of costs n ruble of marketable products. In absolute terms, the change in costs per ruble of marketable output as a result of changes in the cost of production will be determined as the difference between the numerator and denominator of this index.
3). This ratio characterizes the effect of a change in the composition of products on a change in the value of costs per ruble of marketable output. In absolute terms, the change in costs per ruble of marketable products as a result of changes in the composition of products will be determined as the difference between the numerator and denominator of this index.
The product of the calculated ratios corresponds to the ratio of actual and planned costs per ruble of marketable output. And the sum of the absolute values corresponds to the total deviation of the actual costs per ruble of marketable output from the planned ones.
Analysis of the efficiency of using circulating assets and objects of labor of machine-building enterprises
The analysis of efficiency of use of circulating assets and items of engineering enterprises of labor
BaldinKonstantinVasilevich
BaldinKonstantinVasilievich
Doctor of Economics, Professor
Department of Finance and Credit
Makridenko Evgeniy
Makridenko Evgeniy
Job seeker
Department of Finance and Credit
Moscow State Machine-Building University (MAMI)
Olga A. Lezina
LezinaOlgaAleksandrovna
Applicant, assistant
Department of Economics
Ukhta State Technical University
Annotation:In this scientific article it is substantiated that circulating assets are differentiated into circulating production assets and circulation funds.Taking into account the sequence of movement of circulating assets, the necessity of decomposing their turnover into components has been proved.characterize the effectiveness of the successive stages of the movement of working capital.
Abstract:In this scientific article substantiates that the revolving funds are differentiated on the current operating funds and funds of treatment. Given the sequence of movement of working capital, it proved the need for the expansion of their turnover on the components that characterize the effectiveness of the successive phases of the movement of working capital.
Keywords:Efficiency, factors, criteria, resources, circulating funds, circulation funds, financial stability.
Key words:The efficiency factors, criteria, resources, revolving funds, handling funds, financial stability.
An enlarged block among the resources of the production system is considered current assets. The concept of circulating assets is identical to circulating capital, circulating assets and is one of the component parts property of the enterprise necessary for its normal functioning. In terms of the ability to transfer the cost of a resource to results working capital have greater mobility, i.e. completely consumed in a one-time production cycle... In the process of transformation of the status of a resource through costs, they undergo a change in their material and material form, they lose use value in the production process.
Working capital serves the process of functioning of the production system, participates directly in the process of production and sale of products, which is the maintenance of the operating activities of the enterprise. However, in the course of business, the enterprise is engaged not only in the production of capital, but also in the investment of capital and the attraction of capital. Therefore, there are investment and financial activities that also require the attraction of working capital. Based on such a possible application of resources, circulating assets are differentiated into circulating production assets and circulation funds. Circulation funds represent their most liquid form, and are both the initial stage of the movement of circulating assets and the final part of their transformation. Like any resource, circulating assets begin their movement with an advanced value that exists in the form of cash.
Their further transformation is associated with the transition to the form of negotiable production assets, which is characterized by the stage of transformation of funds into production inventories. Inventories, being the material form of advanced working capital as a result of the transition of the advanced value from the monetary form to the productive one, make it possible to combine working capital with fixed assets, as well as with human labor. At this stage, circulating assets have a material form, and their current costs are expressed in material costs, i.e. the status of the resource changes to the status of running costs. As a result of the combination with other factors of production, circulating assets are replenished with consumed non-circulating assets and labor, which is embodied in the created value in the form of a commodity form. The circulating funds again become circulation funds, and then from the commodity form they acquire a more liquid one - in the form of cash and their equivalents.
Revolving funds at each moment of time are in all three forms, and in this regard, the structure of their attraction as well as the speed of their advance is important. The intensity of movement of working capital is traditionally measured by the indicator of the turnover ratio of working capital, or the rate of turnover, calculated as the ratio of proceeds from sales to the value of working capital - current assets (the inverse indicator is the load factor of working capital). It is believed that this indicator reflects the number of revolutions made by circulating assets for the period under study. In reality, this indicator gives an overestimated value, since the result of production, in this case, the proceeds from sales, is a function of all assets, and the determination of the number of revolutions can be carried out only by identifying the private effect corresponding to the use of working capital (this equally applies to all private indicators efficiency).
Since at the second stage of movement, part of the working capital acts in the form of inventories, it is necessary to assess the turnover of this stage. In the practice of analysis, the turnover of inventories is measured by finished products or at cost of goods sold. Also, the cost price is the cumulative effect of the costs of all assets, and since the current costs of inventories are material costs (cost element), it is possible to estimate the inventory turnover by their value.
Taking into account the sequence of movement of circulating assets, let us decompose their turnover into components as follows:
(1)
where NS- the ratio of the turnover of working capital;
Bp- proceeds from products sold;
From about- the average annual value of working capital;
PZ- productive reserves;
M Z- material costs;
V- output.
Elements - factors characterize the effectiveness of the successive stages of the movement of working capital. So, stage 1 characterizes the transfer of the value of current assets to production inventories, displays the structure of current assets. Stage 2 characterizes the turnover of inventories through the transfer of their value to material costs. This indicator is the inventory turnover. The next stage characterizes the effectiveness of the current costs of working capital - material, actually creating a result that has its own name - material efficiency (the opposite indicator is material consumption). And finally, the effectiveness of stage 4 - the rate of implementation - makes a correction external environment in the effectiveness of the use of working capital, as well as in the efficiency of other resources.
The distribution of working capital across the spheres of production and circulation requires a balanced approach. It is believed that the more circulating assets are in the sphere of material production, the higher the efficiency of their use. In our opinion, this is true as far as the main distinctive feature of working capital is concerned - if they are spent, then they are used completely in a single cycle, which characterizes the turnover of the resource stock. However, it is necessary to attract working capital in the sphere of circulation in order to maintain a certain financial condition an enterprise characterized, for example, by liquidity indicators. The optimal structural composition of circulating assets, determined by their involvement in the form of circulating production assets and circulation funds, is a way to increase the efficiency of their use through the balance of funds in inventories, in work in progress and in the form of circulation funds. Thus, production efficiency requires the maximum transition of circulating assets from the monetary form to the material form as an expression of the need to use all resources. Financial stability predetermines the requirements for the structural composition of circulation funds, for their liquidity. This is due to the unity of circulating assets, their ability to move from one type to another, but their initial form and initial resource are cash.
The structural composition of current assets is divided into standardized and non-standardized. Cash, being non-standardized, nevertheless, they have some restrictions on their value, which, first of all, is regulated by the boundaries of changes in absolute liquidity (> 0.2). The emergence of liquidity indicators is associated with the attraction of funds from outside and, therefore, with the emergence of debt. In this regard, the structural composition of circulating assets is investigated from the point of view of property rights in the form of a coefficient of provision with own circulating assets (> 0.1).
The analysis data indicate the dependence of the efficiency of transformation of resources as the stage of their transformation approaches the boundaries of the production system - both in absolute size and in the dynamics of change. Internal transformations experience the least influence of the external environment and, accordingly, are more sensitive to control influences as indicators characterizing the state internal environment production systems.
As the stages of movement of objects of labor, the following are identified: the average annual cost of working capital; the cost of working capital in inventories; material costs; commercial products; proceeds from sales, which is associated with the presence in the practice of analyzing performance indicators of individual stages of the transformation of working capital.
The study of the transformation of objects of labor in the mechanical engineering of Moscow makes it possible to single out the stages, the effectiveness of which has the greatest contribution to the achievement of a useful result. The performed index analysis (the method of chain substitutions) allows us to assert that the efficiency of the stage corresponding to the return of material costs had the greatest positive contribution to the formation of a useful result (sales proceeds). This speaks in favor of the need to increase the production use of objects of labor with a parallel increase in the efficiency of transformation of further stages. It also cuts off the possibility of extensive growth, a decrease in the volume of working capital (negative impact on the volume of proceeds - 125 million rubles).
Fixed and circulating assets, being the most important enough homogeneous groups factors of production, for their inclusion in the production process require the application of costs of the integrating factor - labor. The efficiency of labor use is characterized by an indicator of labor productivity. The labor resource is consumed in the production process, passing to current costs as part of the cost price. A feature of measuring labor productivity is that its costs can be measured in both natural and monetary units.
Within the production system, technological and organizational changes aimed at increasing the efficiency of the factor of production, labor, contribute to its more intensive use. In fact, the goal of increasing labor efficiency is to replace it with capital, which is opposed by the fact that there are certain restrictions on the prospects for growth in labor productivity, established as a result of research by member organizations of the European Association of National Productivity Centers (EANCP) over more than 30 years of its existence. In Russia, since 1993, the representative of the EANCP is the Productivity Center of the Ministry of Health and social development RF.
Usage work force reflected in the social effect. So, each economic entity, possessing limited rationality - i.e. acting in accordance with his experience, the situation, the available information, generates single solutions, including in the field of the use of labor, which make up the overall vector of the economy. Since the beginning of the 90s, significant changes have taken place in the structure of employment, manifested in the outflow of employed labor from the production sphere, as well as in the qualitative composition of the employed. Changes in the composition of the labor resource are manifested as a consequence in their efficiency. In this regard, it is worth noting that such a structural restructuring of the economy, which results in the existing trends in employment in industry and other sectors, is hardly aimed at a transition to a more optimal, productive, efficient structure, since such changes are accompanied by negative dynamics of performance indicators such as individual enterprises and the economy as a whole in the long run.
In the countries with transitional economies of the post-socialist space, the decline in employment occurs in parallel with the decline in production volumes, and with a tendency for the growth of material production, the tendency for a decrease in the number of employed persons persists. In Moscow, supply on the current labor market significantly exceeds demand. The most intensive process of releasing labor in the branches of material production, namely in industry, construction, transport, communications. The reduction in the number of people employed in mechanical engineering in Moscow is ahead of the corresponding trend in the industry as a whole.
There is an obvious connection between the dynamics of labor productivity and wages, which makes the existence of an indicator of the efficiency of labor use in the form of wages and salaries logical. Comparative dynamics of output and labor costs shows the dependence of the usefulness of consumed labor on changes in its value. In developed countries, the growth rate of wages outstrips the growth rate of labor productivity, while in Russia the state of wages in its inadequacy has reached the level of the impossibility of reproduction of the labor force, or at least its individual types.
Data indicate more accelerated last years an increase in labor productivity in comparison with wages. Resources are limited and therefore require payment for restoration. The use of any factor of production is paid according to its current costs. A factor that has received insufficient payment for restoration (for example, labor) does not fully recover, loses quality, degrades, and the level of efficiency of its use decreases. In addition, the use of labor in a certain quantity and quality affects the use of other factors of production - production system that has lost the best part of labor resources, subsequently loses part of other resources. If the high cost of using a resource is another incentive for its efficient use, then it is logical to assume the opposite in the case of payment for the use of labor.
Therefore, the tendency to increase the efficiency of current labor costs through their reduction, which has developed in the mechanical engineering of Moscow, opposes the tendency of a deterioration in the state of the labor resource, if we consider labor costs as payment for the use of its resource. This indicates the need for an optimal structure labor resources, correspondence of the qualification level of the labor unit to the workplace. If, as a result of the current wage policy in Western countries, there is a qualitative improvement in labor resources through the cost of their reproduction, then low wages in Russia, amounting to 8645 rubles per month on average. in mechanical engineering, will invariably lead to their deterioration. In addition, the average wages in mechanical engineering are traditionally lower than in industry as a whole.
Modified production function allows you to assess the dependence of sales on the use of the qualitative composition of labor resources, which indicates the need for investment in labor resources, to improve their quality. This confirms the fact that successfully functioning industrial enterprises the average salary is higher than on the stagnating ones, which contributes to the attraction of a more qualified labor force, the possibility of its selection.
The trends observed at the level of individual enterprises, industries, regions remain at the national level as well. The economic policy of Russia at the current stage, among the main directions and conditions of financial stabilization and sustainable economic growth, distinguishes the provision of outstripping growth rates of real incomes of the population in comparison with the growth rates of gross domestic product. However, in reality, in recent years, the growth rate of gross value added per person in Russia (i.e., productivity at the state level) outstrips the growth rate of the amounts of wages received, which indicates a redistribution of value added in favor of its other elements - gross profit, depreciation , taxes.
The insufficiency of the amounts spent on the reproduction of labor and their discrepancy with its productivity can be illustrated by the following fact, which determines the demand for certain types of mechanical engineering products. In Russia, a single tractor with a train is equal in value to the annual salary of 500 employees of collective agricultural enterprises, and in terms of productivity - less than 50. This means that the labor force is almost 10 times cheaper than the equipment equivalent to it in terms of productivity.
Insufficient rates of economic growth of an enterprise and a decrease in labor productivity have a negative impact on the attraction of labor resources. However, increased labor productivity can also have bad influence for employment, if the level of growth in labor productivity is not accompanied by a higher level of economic growth (dynamics) of the enterprise. There is a decrease in the number of jobs, and the level of employment does not correspond to the available potential - labor resources, i.e. there is a negative balance of this resource. This is exactly the situation in the engineering industry of Moscow.
Thus, the following are identified as stages in the movement of labor: the number of personnel, labor costs, and the volume of marketable products.
The study of the transformation of labor in the mechanical engineering of Moscow allows us to single out the stages, the effectiveness of which has the greatest contribution to the achievement of a useful result. The conducted index analysis (the method of chain substitutions) for years allows us to assert that the efficiency of the stage corresponding to the expenditure of labor resources had the greatest positive contribution to the formation of a useful result (marketable product). This speaks in favor of the need to increase the average wage, but this is not perceptibly happening; moreover, theoretically, the possibilities of extensive growth are cut off while the number of people employed in the mechanical engineering of Moscow decreases.
It follows that for the use of any resource, it is important to match its available size and the level of efficiency of its current costs, which is a condition for increasing its efficiency. The scarcity of resources contributes to their more efficient use, therefore, a more efficient return of current costs, which actually create a result, will depend on the available size of the resource, namely, on its stock. An example of high efficiency of resources while minimizing their passive attraction in the form of reserves has convincingly shown Japanese system management "just in time". In addition, an important condition for the use of all resources is compliance with the principle of organizing production - proportionality.
Deterioration in the use of any resource - quantitative and qualitative - requires compensation for the emerging " bottleneck"Other resources, in the use of which" wide spaces "appear. The relationship between changes in the efficiency of one resource and its immediate reflection in the efficiency of other resources is well known and is based on both the fact of creating a result simultaneously by all factors (resources) of production, and a change in the share of resources in current costs. This was the reason for the appearance of indicators of the interrelationships of the structure of the means used - for example, capital-labor ratio, and suggests the hypothetical existence of indicators such as material-to-labor ratio, power-to-weight ratio, provision of fixed assets with material resources, etc.
At individual machine-building enterprises in Moscow, the process of transformation of factors of production has its own characteristics. So, at PJSC "Karacharovsky mechanical plant" the dynamics of labor instruments at the stages of their transformation fully corresponded to the condition of increasing efficiency, and before that it was the opposite. This is confirmed by calculations of the integral indicator of increasing the efficiency of the use of labor instruments. This is also confirmed by the calculation of the integral indicator of increasing the efficiency of the use of objects of labor. The revealed violations of the dynamics of the transformation of resources in the context of production factors by stages of their transformation indicate a violation of the proportionality of production, a differently accelerated process of movement of resources towards results. Chaotic changes in efficiency at individual stages require systemic management in order to adjust the intensity of transformation of resources at individual stages to arrive at the most beneficial ratio of resources and results.
Literature
1. Economy of Russia. Trends and Prospects (Issue 27) Institute for the Economy in Transition. www. iet. ru
2. Efficiency of functioning of the industrial complex of Russia / Ed. D.S. Lvova M .: Nauka, 2012, p. 121.
New generation online school of English. For more than 7 years it has been providing English language training via Skype (Skype) and is the leader in this area! Main advantages:
- Introductory lesson is free;
- A large number of experienced teachers (native and Russian-speaking);
- Courses are NOT for a specific period (month, six months, a year), but for a specific number of classes (5, 10, 20, 50);
- More than 10,000 satisfied customers.
- The cost of one lesson with a Russian-speaking teacher - from 600 rubles, with a native speaker - from 1500 rubles
Objects of labor (raw materials, materials, fuel energy) are material resources that, with the help of means of labor, are exposed to the influence of human labor in order to give them such forms and properties that a person needs to satisfy his production and personal needs.
To assess the effective use of objects of labor, the following indicators are calculated:
The cost of using materials;
Production output for 1 rub. materials;
Coefficient of the cost of materials in the total cost of objects of labor;
Material consumption - the share of the cost of objects of labor of the cost of production.
A general characteristic of the use of objects of labor can be obtained by analyzing the indicators of material efficiency, material consumption.
The efficiency of the use of labor resources can be judged by the indicators:
1) the dynamics of material costs per 1 rub. products excluding depreciation.
2) relative savings in material costs without depreciation.
3) consumption of the most important types of goods and materials (commodity material of values) per 1 ruble. products in kind.
Rational use of objects of labor (materials) is one of the most important factors in the growth of production and reduction of production costs, and, consequently, growth in profits and profitability.
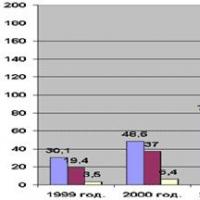
Rice. 3.1 Analysis of equipment use
The tasks of analyzing the use of objects of labor include:
Determination of the level of provision of the enterprise with the necessary material resources;
Identification of excess and scarce types of material values;
Establishment of the degree of rhythm of supplies, as well as their volume, completeness, quality, grade;
Clarification of the timeliness of the conclusion of business contracts for the supply material resources;
Calculation of transport and procurement costs;
Study of indicators of the rationality of the use of material resources in production;
Identification of losses due to various reasons: replacement of materials, downtime of equipment and workers due to lack of necessary materials, etc.;
Assessment of the influence of the organization of material and technical supply and the use of material resources on the volume of production and the cost of production.
One of the indicators of the efficiency of the use of material resources is material efficiency (output per 1 ruble of expended objects of labor).
Brief conclusions:
1. FSA is an effective way of identifying reserves for reducing costs, which is based on finding cheaper ways to perform main functions (through organizational, technical, technological and other changes in production) while eliminating unnecessary functions
2. The ultimate goal of the FSA is to find the most economical options for a particular practical solution from the point of view of the consumer and manufacturer.
3. Functional-cost analysis includes an analysis of the use of means of labor, objects of labor, an analysis of the use of labor resources.
4. The volume and timeliness of work at the enterprise, the efficiency of the use of machinery and equipment and the volume of production, its cost, and profit depend on the rational use of labor resources.
5. The purpose of the analysis of the use of means of labor is to increase the efficiency of work by eliminating various types of time losses and the most complete load of equipment in terms of power and productivity.
6. Rational use of objects of labor allows you to increase the growth of profits and profitability of production.
Control questions:
1. What is the essence of the functional approach to the analysis of an object?
2. Tell us about the types of consumer functions of the object.
3. Algorithm for functional cost analysis.
4. Features and tasks of functional cost analysis.
5. Tell us about the main principles of the FSA.
6. Stages of research on VAS.
7. The program of the individual stages of the FSA.
8. History of the FSA development.
9. Features of the organization of research on FSA in the CIS and leading Western countries.
10. Problems of further development of research on the methodology and organization of the FSA.
Analysis of the efficiency of using production resources
Analysis of the efficiency of using fixed assets
The main indicator of the efficiency of the use of fixed assets is the return on assets.
Ф dpt =, rub. / Rub.
F det 0 = 1.46 rubles / rub. F det 1 = 1.79 rubles / rub.
The following factors affect the return on assets:
DFotd (TP) = = 0.86 rubles / rub.
2) change in the cost of OPF
DF dep (F op) = = -0.53 rubles / rub.
Influence of two factors:
DF dep = DF dep (TP) + DF dep (F op) = 0.86-0.53 = 0.33 rubles / rub.
DF det = F det 1 - F det 0 = 0.33 rubles / rub.
Relative savings:
E oFop = F op 0? I рп - Ф op 1 = 688 004 * 1.46 - 891 155 = +113 331 thousand rubles.
When analyzing the efficiency of the use of fixed assets, the return on assets was calculated, its increase by 23% indicates the rational use of fixed assets, which gives the enterprise an income of 113,331 thousand rubles.
The change in capital productivity was influenced by an increase in the cost of fixed assets by 30% and an increase in marketable output by 59% in the analyzed period.
Analysis of the effectiveness of the use of objects of labor
The main indicator of the use of objects of labor is the consumption of materials.
Me =, RUB / RUB
M e 0 = 1.79 rubles / rub. M e 1 = 1.79 rubles / rub.
The material consumption is influenced by factors:
1) change in material costs
DM e (M z) = = +0.33 rubles / rub.
2) change in marketable products
DM e (TP) = = -0.33 rubles / rub.
The overall influence of two factors:
DM e = DM e (M s) + DM e (TP) = 0.33 - 0.33 = 0 rubles / rub.
DM e = M e 1 - M e 0 = 0 rubles / rub.
Relative overrun:
E about Mz = M z 0? I rp - M z 1 = - 1 243 thousand rubles.
The material consumption was influenced by an increase in marketable output by 59%. Material costs, in turn, increased by 59%, which is due to an increase in production.
The result of ineffective use of objects of labor was a cost overrun of 1 243 thousand rubles.
Analysis of the effectiveness of the use of labor resources
The main indicator of the effectiveness of the use of labor instruments is labor productivity, i.e. production per person.
P m =, thousand rubles / person
P t 0 = 1567 thousand rubles / person P t 1 = 1996 thousand rubles / person
Factors influence the value of labor productivity:
1) change in marketable products
DP t (TP) = = 928 thousand rubles / person.
2) change in the number of personnel
DP t (PE) = = -499 thousand rubles / person
Influence of two factors:
DP t = DP t (tp) + DP t (P) = 928-499 = 429 thousand rubles / person.
Relative damage:
E oFzp = F zp 0? I рп - Ф Зп 1 = -21 758 thousand rubles.
After analyzing the efficiency of the use of labor instruments, we see that labor productivity increased by 27%. There was an increase in marketable output by 59%, as well as an increase in the number of personnel by 25%, so production in 2009 increased.
At the enterprise, the following is observed: wages are growing more slowly than labor productivity. This testifies to the intensive path of development of the enterprise. In general, this state at the enterprise characterizes the inefficiency of the use of human resources.
 Coursework: Prospects for the Development of Electronic Money in Russia Circulation of Electronic Money
 Instant quality control throughout the entire winemaking process
 Reputation management: modern approaches and technologies
 Information about the Department of International Economic Relations Textbooks and teaching aids published abroad
 Practice report in an advertising agency
 The youngest and most successful businessmen in the world
 New promising professions: who to be in the 21st century Professions that appeared in the 20th 21st centuries