Threshold profitability. Profitability threshold. Financial safety margin. Operating lever - Abstract. It is determined by the formula
Consider the threshold of profitability of the enterprise, the calculation formula and its relationship with the break-even point and stock financial strength.
Profitability threshold(analog.BEP,breakevenpoint, break-even point, critical point, profitability threshold) Is the sales volume of the enterprise at which the minimum level of profit (equal to zero) is achieved. In other words, the enterprise operates on the self-sufficiency of its costs. The profitability threshold of an enterprise is sometimes called in practice.
The purpose of assessing the threshold of profitability in determining the minimum permissible level of production and sales, on the basis of which the financial strength margin necessary to maintain the sustainable functioning of the enterprise is calculated. The profitability threshold is assessed by the owners of the enterprise when planning future production and sales volumes, as well as lenders and investors when assessing financial condition.
When calculating the profitability threshold, two types of costs (costs) are used:
- Fixed costs (eng.VA,VariableCosts)- the type of costs of the enterprise, the size of which does not depend on changes in the volume of production and sales of products.
- Variable costs (eng.FC,FixedCosts)- the type of costs of the enterprise, the size of which directly depends on the volume of production and sales of products.
Fixed costs include - costs for wages personnel, rent of production and other premises, deductions for the unified social tax and property tax, marketing costs, etc.
Variable costs consist of costs for raw materials, materials, components, fuel, electricity, bonus part of staff salaries, etc.
The sum of all fixed costs forms the total fixed and variable costs of the enterprise (TVC, TFC).
To calculate the profitability threshold of an enterprise, the following two formulas are used analytically:
BEP 1 (Breakeven point) - the threshold of profitability in monetary terms;
TR (Total Revenue) - proceeds from product sales;
TFC (Total Fixed Costs) - total fixed costs;
TVC (Total Variable Costs) - cumulative variable costs.
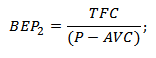
BEP 2 (Breakeven point) - the threshold of profitability expressed in physical terms (production volume);
P (Price) - unit price of goods sold;
AVC ( Average Variable Costs) - the average variable costs per unit of goods.
 |
★ |
Calculating the threshold of profitability in Excel
To calculate the profitability threshold, it is necessary to calculate the fixed, variable costs of the enterprise and the volume of sales (sales) of the goods. The figure below shows an example of the main parameters for calculating the profitability threshold.

Basic parameters for assessing the threshold of enterprise profitability
At the next stage, it is necessary to calculate how the profit and costs will change from the volume of sales of the goods. Fixed costs, presented in column "B", they will not change with the volume of production. Variable unit costs will increase in proportion to production (column "C"). The formulas for calculating income and costs will be as follows:
Enterprise variable costs= $ C $ 5 * A10
Total enterprise costs= C9 + B9
Income= A9 * $ C $ 6
Net profit= E9-C9-B9
The figure below shows this calculation. The profitability threshold in this example is reached with a production volume of 5 pieces.

Assessment of the threshold of enterprise profitability in Excel
Suppose another situation, when the sales volumes, variable and fixed costs are known and it is required to determine the profitability threshold. To do this, you can use the above analytical calculation formulas.
Profitability threshold in monetary terms= E26 * B26 / (E26-C26)
Profitability threshold in kind= B26 / (C6-C5)

Calculating the level of profitability using formulas in Excel
The result is similar to the “manual method” of determining the profitability threshold. It should be noted that in practice there are no absolutely fixed or completely variable costs. All costs are in addition to "nominally fixed" and "nominally variable" costs. The fact is that with an increase in output, a "scale effect" arises, which consists in a decrease in the cost (variable costs) of producing a unit of goods. Also with fixed costs, which can also change over time, for example, the rental rate for the premises. As a result, with the transition of an enterprise from serial to mass production, an additional rate of profit and an additional margin of financial strength arise.
Determination of the threshold of profitability graphically
The second way to determine the threshold of profitability is with the help of a graph. For this, we will use the data obtained above. As you can see, the profitability threshold corresponds to the point of intersection of income and total costs of the enterprise, or equality net profit zero. The critical level of profitability is achieved with a production volume of 5 units.

Graphical analysis of the income and expenses of the enterprise
The threshold of profitability and the margin of financial strength of the enterprise
Determination of the minimum acceptable level of sales allows you to plan and create a margin of financial strength - this is excess sales or net profit, which allows the company to function and develop steadily. For example, if the current volume of production (sales) corresponds to 17 pieces, then the margin of financial strength will be equal to 240 rubles. The graph below shows the area of the company's financial strength with a sales volume of 17 pieces.

The financial strength of the enterprise
The margin of financial strength shows the remoteness of the enterprise from the break-even point, the greater the margin of safety, the more financially stable the enterprise is.
|
★ (calculation of Sharpe, Sortino, Trainor, Kalmar, Modilyanka beta, VaR ratios) + predicting course movement |
Summary
The threshold of profitability allows you to assess the critical level of production of the enterprise, at which its profitability is equal to zero. This analytical assessment is important for strategic management and developing strategies for increasing sales and planning production volumes. Currently, sales are influenced by many various factors: seasonality of demand, sharp changes in the cost of raw materials, fuel, energy, production technologies of competitors, etc. all this makes the company constantly look for new opportunities for development. One of the modern promising directions increase in production is the development of innovation, as it creates additional competitive advantages in the sales market.
How to determine the threshold of profitability in 2020? For these purposes, the company uses several calculation options that allow you to get the most accurate value.
Dear Readers! The article talks about typical ways of solving legal issues, but each case is individual. If you want to know how solve your problem- contact a consultant:
APPLICATIONS AND CALLS ARE ACCEPTED 24/7 and WITHOUT DAYS.
It's fast and IS FREE!
Any kind entrepreneurial activity carries one main task - getting the maximum income. Otherwise, there is no point in it.
One of the key factors that affects income generation is the implementation of an effective, correct and at the same time timely financial and economic position of the company and the ability to use the available resources.
The indicator of the threshold of profitability is very important for the further effective business activity of any company.
The value of profitability can fully show the number of products that need to be manufactured and sold in order to recoup costs.
This rule applies to the provision of any services. Let us consider in more detail the procedure and methods for calculating the profitability threshold.
General points
Before starting to address the main issue, it is initially recommended to consider the basic theory regarding the threshold of profitability.
Additionally, you need to study and legislative regulation of this issue, which, although superficially, nevertheless clarifies the need for calculating this indicator.
What it is
The main indicator of the effectiveness of any type of entrepreneurial activity is considered to be income, which can be predicted after determining the threshold of profitability.
The profitability threshold is the sales proceeds at which it is possible to cover all existing costs without incurring losses.
In other words, financial activities equates to zero in the process of complex use of labor, money and material resources.
It is often expressed in terms of interest, as well as on one unit of funds that have been invested in income.
At its core, profitability is the profitability or profitability that a company can receive from the results of its entrepreneurial activities.
It can be calculated for all types of goods, which fully allows you to analyze the activities of a particular production.
Today, economists around the world are calculating financial position companies using the indicator of the profitability ratio, thanks to which you can find out the probability of the projected investment.
Profitability of implementation - implies the value or the ratio of the share of income in each financial unit. Moreover, it is a kind of indicator that influences the pricing policy.
The profitability of the sale is determined on the basis of the ratio of income to direct proceeds from the sale of all goods without exception.
For what purpose is it calculated
A certain threshold of profitability makes it possible to characterize the labor activity of the company in full, rather than the income itself.
Thanks to the indicator, you can find out the overall ratio of the use of resources and those that are currently available in the organization.
The calculation of the indicator is used not only to analyze the activities of the organization, but also to determine the likelihood of future and pricing policy.
It is necessary to pay attention to the fact that the value of the profitability indicator of the organization, goods or sales, is determined by the ratio of the received information of net income, proceeds from the sale of goods and the balance sheet.
It is necessary to pay attention to the fact that the increase in profitability (if necessary) of the company is facilitated by the direct manipulation of several important values, namely:
- acceleration of the growth rate of trade turnover;
- reduction of the existing mass of costs;
- increasing the rate of return by increasing the cost.
It should be noted that the Western market is confident that the long-term period of profitability of organizations directly depends on an impressive number of factors (there are more than 30) that can characterize the position of the competitive situation, as well as directly on the manufacturer's market, the existing economic environment, and so on.
Based on this, it is extremely important in the process of analyzing profitability indicators not to lose sight of some other important factors, namely:
- the level of capital intensity;
- available quality of goods or provided;
- the existing market share of the company (domestic or international);
- labor force efficiency indicators.
Paying attention to such indicators, you can produce the most effective analysis profitability in order to improve efficiency.
Legal regulation
The legislation of the Russian Federation does not contain any specific legislative act regulating the issue of calculating and assigning the profitability threshold.
At the same time, it is necessary to pay attention to, which indicates:
"The financial independence or profitability of the audited entity directly depends not only on general economic and industry factors, but also on other business conditions"
In addition, other important nuances are displayed in the specified act.
How to calculate the threshold of an organization's profitability
Before proceeding with the consideration of the basic formulas for calculating profitability, it is recommended to additionally know about the graphical version.
This option is able to visually display the period and the existing circumstances under which labor activity the company increases or, on the contrary, decreases.
The graph can be built like this:
The profitability threshold shows the performance of a particular company.
What is the calculation formula
Depending on the form in which it is necessary to make profitability calculations, companies use:
Let's consider each of the formulas in more detail.
In cash
The formula for profitability in monetary terms is:
Let's consider the calculation procedure using an example. The company sells 200 units of products at a cost price of 300 rubles per unit.
Variable costs for each unit are about 250 rubles. Direct costs in the cost of 1 unit - 30 rubles. Indirect direct financial costs are 20 rubles.
Let's define the break-even point of the company. For these purposes, it is necessary to calculate the threshold of profitability in value terms:
As a result of the calculations, it can be seen that the company can receive income after the sale of products in the amount of over 60 thousand rubles.
If in kind
If necessary, carry out calculations in in kind, you need to use the formula:
For the purpose of considering an example of calculation, the initial information will be taken from the previous version of the calculation.
Based on this, the profitability threshold will be calculated as follows:
After the obtained indicators in the calculation, we can say that the company will be able to count on a certain level of profitability after the sale of 200 units of goods.
Mathematical method of determination
The general formula for the mathematical expression of the profitability threshold is:
Calculation using such a formula is straightforward. It is enough only to follow the reliably specified information.
What factors affect the indicator
The main factors that affect the indicators of the profitability threshold are considered to be:
- cost of selling 1 unit of goods;
- variable and fixed costs of production, sales and management.
With the modification of these factors, the profitability threshold indicators can increase or decrease.
In the process of determining the threshold of profitability, production costs can be divided:
- for permanent;
- and variable costs.
In the first case it comes about constant or conditionally constant costs during a specific time period.
Video: break-even point
At the same time, you need to understand that in the process of determining for each unit of manufactured goods, the adjustment of the level of production in the organization will also directly depend.
Fixed costs often include:
- financial costs for;
- depreciation charge;
- costs for;
- accrual to hired employees of the management apparatus;
- administrative costs and so on.
Most of the fixed costs, in contrast to the variables, in the process of decreasing production volume is very difficult to reduce to a minimum.
If we talk about variable generalized costs, then they directly depend on the production volume.
Variable costs that fall on each unit of manufactured goods will further be referred to as fixed costs.
Variables include:
- the cost of remuneration of the hired staff of employees;
- transportation costs;
- trade and commission costs;
- expenses for the purchase of the necessary material and raw materials;
- energy consumption costs and so on.
Variable costs are often referred to as those that cannot be predicted with accuracy.
Which enterprises have a higher value
It is necessary to understand that companies begin to receive income only after, in fact, the revenue begins to exceed the threshold.
In other words, the higher this indicator, the greater the financial strength of the company and the size of the income itself.
Based on this, we can say that the maximum profitability indicators are available in those companies where there are impressive volumes of production with minimal costs.
How can you reduce it
Increasing the gross margin is considered to be the only option that allows you to lower the profitability threshold.
In other words, the marginal income, which is equal to fixed costs in the period of a critical indicator of the volume of sales.
In such a situation, it is extremely important:
- Increase the volume of sales of goods.
- To increase the cost of goods, however, within the limits of effective demand.
- Reduce variable costs. In particular, it is necessary to reduce - wages, rent or payments for utilities.
- Significantly reduce fixed costs, which can increase the threshold of profitability and at the same time reflect the level of risk of doing business.
In order to ensure the operability of the organization and at the same time successful further development, it is extremely important to achieve a competent combination of fixed costs with a high gross margin.
44. Determination of the threshold of profitability (breakeven production).
Profitability threshold - it is such a sales proceeds in which the enterprise no longer has losses, but does not yet have profits. The gross margin is exactly enough to cover fixed costs, and Pr is zero.
Profitability threshold (break-even point, critical point, critical volume of production (sales)) - this is the volume of sales of the company, at which the proceeds from sales fully cover all expenses for production and sales of the product. To determine this point, regardless of the methodology used, it is necessary first of all to divide the projected costs into fixed and variable costs.
The practical benefits of the proposed division of costs into fixed and variable costs (the value of mixed costs can be neglected or proportionally attributed to fixed and variable costs) is as follows:
First, it is possible to determine exactly the conditions for the termination of production by the firm (if the firm does not pay off the average variable costs, then it must stop producing).
Secondly, it is possible to solve the problem of maximizing profits and rationalizing its dynamics for given parameters of the firm due to the relative reduction of certain costs.
Thirdly, such a division of costs allows us to determine the minimum volume of production and sales of products, at which a business break-even is achieved (profitability threshold), and to show how much the actual volume of production exceeds this indicator (margin of the firm's financial strength) ...
The profitability threshold is determined as proceeds from sales, in which the company no longer has losses, but does not receive profit either, i.e. fin-s from the sale after reimbursement of variable costs is enough only to cover fixed costs and Pr is equal to zero.
Break-even point in kind for the production and sale of a specific product ( T b ) is determined by the ratio of all fixed costs for the production and sale of a particular product ( Z fast ) to the difference between the price (revenue) ( C ) and variable unit costs ( Z beats per. ):
Break-even point in value terms is defined as the product of the critical volume of production in kind and the price of a unit of production.
The calculation of the threshold of profitability is widely used in planning profit and determining the financial state of the enterprise. Two rules useful for an entrepreneur:
1. It is necessary to strive for a position when revenue exceeds the threshold of profitability, and to produce goods in kind in excess of their threshold value. This will increase the company's profits.
2. It should be remembered that the force of influence of the pr-venny lever is the greater, the closer the pr-in is to the threshold of profitability, and vice versa. This means that there is a certain limit for exceeding the profitability threshold, which must inevitably be followed by a jump in fixed costs (new labor resources, new premises, an increase in enterprise management costs).
The firm must necessarily pass the threshold of profitability and take into account that after the period of increase in the mass of profit, there will inevitably come a period when, in order to continue the production (increase the production output), it will simply be necessary to sharply increase fixed costs, which will inevitably lead to a reduction in the profit obtained in the short term ...
When making a specific decision on the volume of production, the entrepreneur should reckon with these conclusions.
Pr = Gross margin- Fixed costs = 0 or, which is also:
Pr = Threshold of profitability * gross margin in relative terms to revenue - constant. Cost = 0
From the last formula, we get the value of the profitability threshold:
Profit threshold = Const. Costs / Gross Margin as Relative to Revenue
Let us note in this connection three moments that are most useful for the financier.
First... Having determined what quantity of goods produced corresponds, at given selling prices, the threshold of profitability, you get the threshold (critical) value of the volume of production (in pieces, etc.). It is unprofitable for the enterprise to produce below this amount: it will cost "more expensive for itself". The formulas commonly used are:
Here, however, there is a nuance. The threshold value of the volume of production, calculated according to formula 1, coincides with that value calculated according to formula 2, only when it comes to one single project. But if it is supposed to produce several Tovs, then the calculation of the volume of production that provides break-even, for example, Ta No. 1, is carried out most often according to a formula that takes into account the role of this Ta in the total sales proceeds and thus its share in fixed costs. Then, instead of formula 2, use formula 3:
Second. Having passed the threshold of profitability, the firm has an additional amount of gross margin for each successive unit of Ta. Naturally, the mass of profits is also growing.
To determine the mass of profit after passing the profitability threshold, it is enough to multiply the number of Ta sold in excess of the threshold volume of production by the specific value of the gross margin "sitting" in each unit of Ta sold:
The third. As already noted, the strength of the operating leverage is greatest near the profitability threshold and decreases with the growth of sales revenue and profit, since specific gravity fixed costs in the total amount decreases - and so on until the next "jump" in fixed costs.
Any business is created with the aim of making a profit, and sometimes it is important to understand at what volume of sales the company will operate at a loss, and when it will start making a profit. The line dividing these volumes has a self-explanatory name - the threshold of profitability, that is, the level at which there is still no profit, but there is no loss either. Thus, the threshold of profitability is the moment of self-sufficiency. It is often called the break-even point, and it is effective tool when planning production, assessing the volume of sales, payback periods and financial risks.
Profitability threshold: formula
in natural units, when they determine the number of units of production that should be sold in order to cover the costs incurred and reach zero profit (PR 1);
in monetary terms, which determines the cost of this volume (PR 2).
The calculation of PR is based on cost indicators - constant (remaining unchanged with fluctuations in output and sales) and variables (changing depending on changes in production and sales). Permanent assets include property depreciation, AUP salary, marketing costs, rent and utility bills. Variables are the costs of purchasing raw materials and components, salaries of shop workers, payment of the cost of energy and heat resources, etc.
The PR value of 1 determines the sales volume at which the profit will be zero.
The formula for calculating PR in natural units:
PR 1 = P post / unit / (C unit - P per / unit),
where P post / unit and P per / unit is the average sum of fixed and variable costs per unit of production,
C unit - the price of a unit of goods.
The PR indicator in monetary terms is calculated by the formula:
PR 2 = V x P post (V - P lane),
where P post and P lane are the total fixed and variable costs,
B - revenue.
The PR value in this case determines the cost of the produced and sold goods by the time the payback is achieved.
Calculating the threshold of profitability: an example
Let's say a company manufactures and sells products, each unit of which has an average of 200 rubles. fixed costs and 100 rubles. variables. The unit price is 150 rubles.
|
Issue volume |
Expenses |
Total costs |
Sales income |
Profit |
|
|
permanent |
variables |
||||
Using the formulas, we calculate:
PR 1 = P post / unit / (C unit - P per / unit) = 200 / (150 - 100) = 4, that is, to reach the break-even point, you need to sell 4 units of goods.
PR 2 = B x P post / (B - P per) = 150 x 200 / (150 - 100) = 600 rubles, i.e. in monetary terms, the volume of output and sales to reach the profitability threshold will be 600 rubles.
These calculations show the analytics - if the sales volume does not reach the calculated values - the company incurs losses, and vice versa, the excess of the indicators indicates that the company makes a profit, having overcome the zero line.
The simplicity of the calculations of this example is due to the ideal initial data, which, of course, cannot be found in real conditions: all indicators remain unchanged, although in life an increase in sales volumes causes an increase in costs, and it is not always possible to fully sell all manufactured products. We are only introducing the reader to the calculation algorithm, and the company will have to adapt the calculations to the current market situation on its own.
We offer a more complex version of calculating PR.
Example: how to calculate the threshold of profitability for a manufacturing plant
An industrial enterprise specializing in the production of 3 types of parts. In the table, we combine both the initial data and the calculation of PR:
|
Index |
Details |
Total |
|||
|
sales of products in pieces |
|||||
|
price of 1 unit of production in rubles. |
424 (avg.price) |
||||
|
revenue in rubles |
|||||
|
Variable costs |
|||||
|
salary |
|||||
|
overhead costs |
|||||
|
Total variable costs |
|||||
|
Profit in total (art. 03 - page 9) |
|||||
|
Profit per unit products (p. 10 / p. 01) |
|||||
|
variable costs per unit. ex. (p. 9 / p. 01) |
|||||
|
Fixed costs |
|||||
|
utilities |
|||||
|
AUP salary + insurance premiums |
|||||
|
Total fixed costs |
|||||
|
income tax |
|||||
|
Total fixed costs |
|||||
|
Total costs (p. 19 + p. 9) |
|||||
|
OL in pcs. (p. 19 / (p. 02 - p. 12) |
|||||
|
PR in rub. (p. 03 x p. 19 / (p. 03 - p. 9) |
105908,70 |
||||
Having grouped the costs by variable and constant criteria, we calculate the profitability threshold:
PR 1 = P post / (C unit - P per / unit) = 58000 / (424 - 191.8) = 249.78 pcs.
PR 2 = B x P post / (B - P per) (212000 x 58000) / (212000 - 95900) = 105908.70 rubles, i.e., in order to reach the break-even level and cover the investment costs, it is necessary sell 249.78 units. goods for the total amount of 105,908.70 rubles. Further sales will be profitable.
(Threshold of profitability)
- the volume of production (sales) at which the company covers all its costs without making a profit. The term is also used profitability threshold.
The value of this indicator plays important role on the issue of stability and solvency of the company. The degree to which sales volumes exceed the profitability threshold determines the (stability margin) of the enterprise. In turn, how the profit grows with the change in revenue shows.
The formula for calculating the break-even point
For the calculation, you need to divide the costs into two components:
- - increase in proportion to the increase in production (sales volume). For example: the cost of raw materials and supplies. In the simplest case, this is the cost of purchasing a product.
- - do not depend on the amount of products produced (goods sold) and on whether the volume of transactions is increasing or decreasing. For example: rent, salary management personnel.
Let us introduce the notation:
| IN | — | sales proceeds. |
| NS | — | sales volume in kind, in pieces, meters, kilograms, etc. |
| Zper | — | total variable costs. |
| Zpost | — | fixed costs. |
| C | — | unit price. |
| ZSper | — | average variable costs per unit of output. |
| TBd | — | break-even point in monetary terms. |
| TBn | — | break-even point in kind. |
The formula for calculating the threshold of profitability in monetary terms:
(in rubles, dollars, etc.)
TBd = B * Zpost / (B - Zper)
Calculation formula in kind:
(in pieces, kilograms, meters, etc.)
TBn = Zpost / (C - ZSper)
Break-even point calculation example and graph
| Zpost | = | 300 - fixed costs |
| C | = | 25 - unit price (per piece). |
| ZSper | = | 10 - variable costs per unit of production |
Profitability threshold in kind:
TBn = 300 / (25-10) = 20 (pcs.)
The meaning of the indicator is seen more clearly in the graph.
- Axes:
- On the horizontal axis - the number of products sold
- Vertical axis - money
- Chart lines:
- Red - total costs (Zper + Zpost)
- Blue - income (revenue)
- Green - profit
As you know, there are several types of profit: gross; operating room; before taxes; clean; before interest, taxes and depreciation (EBITDA), etc. In this case, this is operating profit.
What does the break-even point chart show us?

- As seen in the graph:
- The breakeven point increased to 40.
- The line of total costs has moved up, this is caused by an increase in fixed costs. Its slope has not changed since the slope depends on variable costs.
- The distance between the line of the Marginal income and the line of profit has increased, this is caused by an increase in fixed costs.
- We can conclude:
- An increase in fixed costs leads to an increase in the break-even point, that is, in order to break-even, more units of the product must be sold. This is bad for business.
- Accordingly, their reduction leads to a decrease in the break-even point; to reach the break-even point, fewer units of goods must be sold. This is good for business.
Example 3. Graph of the profitability threshold with an increase in variable costs
Now we will increase the variable costs to 20 units. Constant 300, price 25.
- As seen in the graph:
- The breakeven point increased to 60.
- Compared to the initial variant, the slope of the total cost line has increased, the income line catches up with it only by 60. The slope depends on variable costs.
- The slope of the profit line has decreased, it grows more slowly. The slope is determined by the difference between price and variable costs. In the original version, this difference is 15 (25-10), in this example, the difference is 5 (25-20).
Conclusion: the break-even point rises with an increase in variable costs and decreases with a decrease.
Example 4. Chart with a decrease in price
Let's reduce the price to 20 units. Fixed costs 300, variable 10.
- As seen in the graph:
- The break-even point is 30.
- Compared to the original version, the slope of the income and profit lines has decreased, they grow more slowly. The slope depends on the price difference and variable costs. In the original version, this difference is 15 (25-10), in this version, the difference is 10 (20-10).
Conclusion: the break-even point rises with a decrease in price, decreases with an increase in price.
The break-even point depends on three parameters - fixed and variable costs, prices. In our examples, we changed only one parameter each time compared to the original version.
In practice, the behavior of the profitability threshold is of interest when several parameters change, for example: how to compensate for the increase in variable costs by increasing prices or reducing fixed costs. For quick calculation possible options and assessing the impact of different cost-price ratios, it is convenient to use Excel spreadsheets.
Profitability threshold
AND profitability threshold these are synonyms. But, profitability is a relative measure of profitability and is usually expressed as a percentage of the invested funds or in the amount of profit per unit of invested funds or per unit of production. In this regard, it is interesting to see what the break-even point graph looks like when recalculated per unit of production.
In the graph below, as in the original version, fixed costs 300, variable per unit of production 10, price 25, profitability threshold TBn = 20 pieces.
When recalculated per unit of production, we see that some constant values have turned into variables and vice versa. Some straight lines have turned into curves.
- The graph shows that:
- The proportion of variable costs is constant for each unit of production.
- As volume grows, the share of fixed costs per unit of product decreases. Therefore, the line of fixed costs goes down.
- As a result, the total cost per unit of production (cost) decreases.
- With a production volume of 20 pcs. the cost line crosses the price line (the cost is equal to the price) and then goes below it.
- Accordingly, the profit line goes through 0, the profit becomes positive.
- At the point of the profitability threshold, the line of fixed costs crosses the line of marginal profit (marginal income), i.e. marginal income is equal to fixed costs. Further, the line of marginal profit goes above the line of fixed costs - profit appears.
Difficulties in calculating the break-even point
It seems that the formula for the break-even point is pretty simple, and there should be no difficulty in calculating. But the matter is complicated by the fact that several important assumptions were made in the derivation of the calculation formula.
Four assumptions when calculating the break-even point
- The calculation formula uses the difference between revenue (sales) and variable costs, or the difference between the price of a product and variable costs per unit. That is, the difference between the proceeds from the sale and the funds spent on the production or purchase of products is used. Therefore, it is believed that all for sale produced or purchased production... Stocks are not taken into account because no revenue has been received from their sale.
- Variable costs are directly proportional (linear) dependent from sales. This is not always the case. For example, the case when a new workshop had to be built to increase the volume of production would have to be calculated in a more complicated way.
- Fixed costs are independent from sales. This also does not always happen. If in order to increase the volume of production it was necessary to build a new workshop, hire more management personnel, and increase utility bills - this case also does not fit the general formula.
- The break-even point is calculated for the enterprise as a whole or for some average product.
When calculating the break-even point, the most important limitation is assumption 4. To make the calculation not averaged, but for each product separately, you need to know what proportion of fixed costs falls on each of the products. We need a methodology for the distribution of fixed costs for individual goods... In addition, if there are a lot of products, the calculation of break-even points separately for each product turns into difficult task computationally intensive.
 What you need to open a hookah lounge, and how to do it correctly
 How to start a business and choose donut equipment
 Opening a company in Montenegro Open a company in Montenegro
 The carpentry shop as a business
 How to choose a business direction?
 Sample business plan of a dental office
 Five best business ideas that brought millions What business to open so as not to go bankrupt